IGCSE Physics Past Years Exam Questions: Solids, liquids and gases
We analysed the International GCSE past papers and grouped the questions by topic. Here, you will find questions relating to the topic – Solids, liquids and gases. Use these to familiarise, practice and prepare for your IGCSE Physics examination.
What you need to know
Use the list below as a quick recap for what you need to know before attempting the past year exam questions under this topic. This is based on Edexcel International GCSE in Physics (4PH1) specification with first teaching Sept 2017 and first examination June 2019.
Paper 1 and 2: (5) Solids, liquids and gases
Paper 1 covers all the topics except where it is marked “Paper 2 only” while Paper 2 covers all topics.
A. Units
- degree Celsius (°C), Kelvin (K), joule (J), kilogram (kg), kilogram/metre3 (kg/m3), metre (m), metre2 (m2), metre3 (m3), metre/second (m/s), metre/second2 (m/s2), newton (N) and pascal (Pa)
- use the following unit: joules/kilogram degree Celsius (J/kg °C)
B. Density and pressure
- relationship between density, mass and volume. ρ = m/V
- investigate density using direct measurements of mass and volume.
- relationship between pressure, force and area. p = F/A
- pressure at a point in gas or liquid acts equally in all directions.
- relationship between pressure difference, height, density and gravitational field strength. p=h×ρ×g
C. Change of state (Paper 2 only)
- that heating a system will change the energy stored in that system. (raise its temperature or product changes of state)
- changes that occur when a solid melts to liquid and when a liquid boils or evaporates to gas.
- describe the arrangements of atoms in solids, liquids and gases.
- temperature-time graph to show a constant temperature during a change of state.
- specific heat capacity of a substance is the energy required to change the temperature of 1kg of a substance by 1°C. (J/kg °C)
- equation relating to the change in thermal energy to mass, specific heat capacity and temperature change. ΔQ = m × c × ΔT
- investigate the specific heat capacity of materials including water.
D. Ideal gas molecules
- how molecules in a gas have random motion and exert a pressure on the sides of their container
- understand why there is absolute zero at -273°C.
- describe Kelvin scale of temperature and convert between Kelvin and Celsius scales.
- increase in temperature results in increase in average speed of molecules.
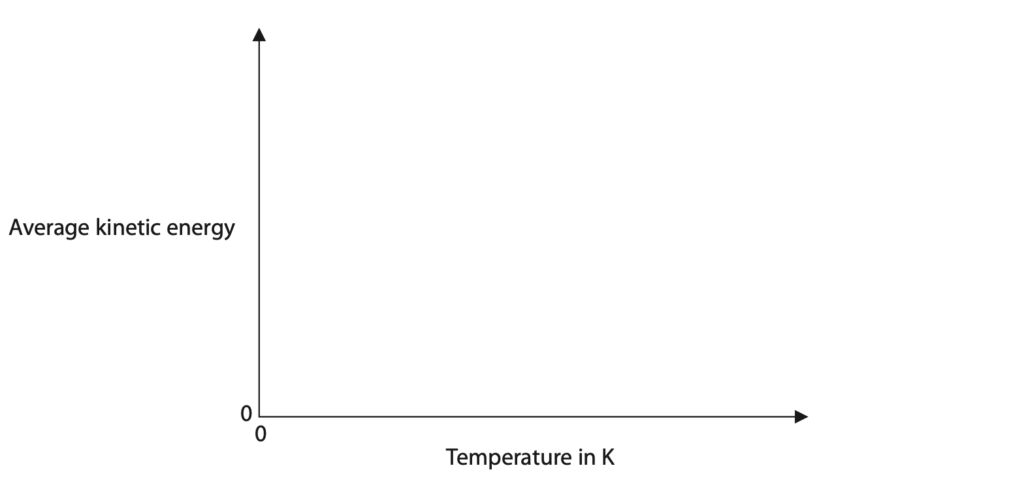
- Kelvin temperatures of a gas are directly proportional to the average kinetic energies of its molecules.
- explain for a fixed mass of mass, the qualitative relationship between:
- pressure and volume at constant temperature;
- pressure and kelvin temperature at constant volume.
- the relationship between the pressure and kelvin temperature of a fixed mass of gas at constant volume. P1/T1 = P2/T2
- relationship between pressure and volume of a fixed mass of mass at constant temperature. P1V1=P2V2
June 2019 Paper 1 Q11
11. The diagram shows a manometer, a device used for measuring differences in pressure.
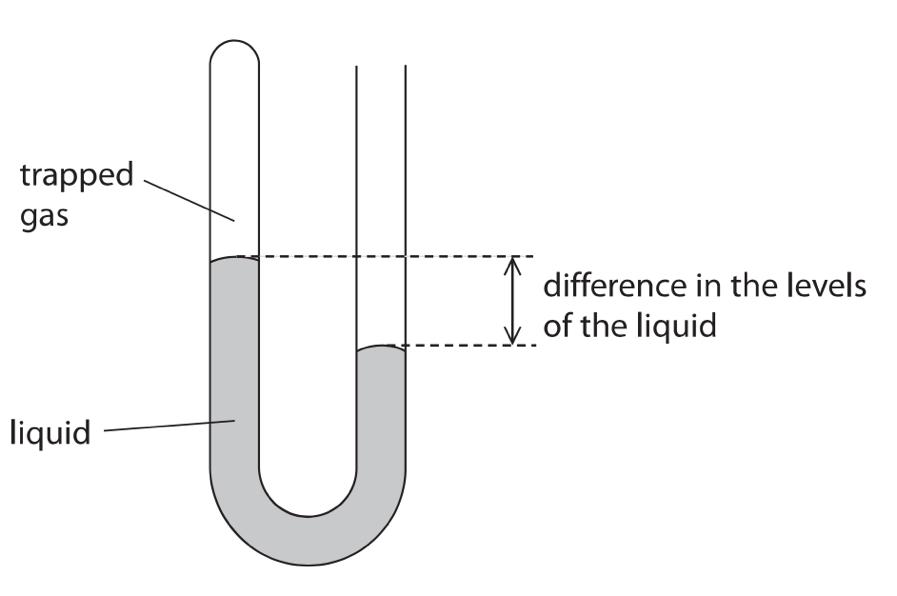
(a) One side of the manometer has some trapped gas. The other side is left open to the atmosphere.
The difference in pressure can be calculated using this formula.
[difference in pressure = height x density x 10]
The density of the liquid is 1.3 x 10⁴ kg/m3.
The difference in the levels of the liquid is 3.8cm.
Calculate the difference in pressure between the atmosphere and the trapped gas.(3)
difference in pressure = ……………………………………Pa
(b) The temperature and pressure of the trapped gas increase when it is warmed.
(i) Explain, in terms of particles, why the pressure of the trapped gas increases.(3)
(ii) The pressure of the trapped gas in the manometer I 9.95 x 10⁴ Pa and the temperature is 16oC
Calculate the new pressure of the trapped gas if the temperature increases to 32oC
[assume volume of the trapped gas remains constant] (4)
new pressure = ……………………………….Pa
Total for Question 11 = 10 marks
June 2019 Paper 1PR Q6
6 The photograph shows a small glass ball used to investigate density and pressure.
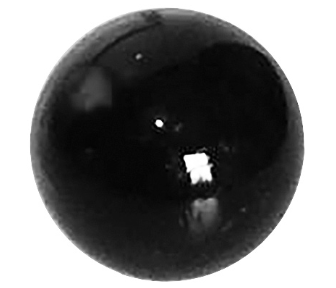
(a) The mass of the ball is 19 g.
The density of the ball is 2.3 g/cm3.
(i) State the formula linking density, mass and volume. (1)
(ii) Calculate the volume of the ball. (2)
volume = ……………………………………….. cm3
(b) The ball is dropped into deep water and sinks to a depth of 560 cm.
(i) State the formula linking pressure difference, height, density and gravitational field strength. (1)
(ii) Calculate the increase in pressure at this depth.
[density of water = 1000 kg/m3] (2)
increase in pressure = ……………………………………….. Pa
Total for Question 6 = 6 marks
June 2019 Paper 2 Q9
9 This is a question about a melting ice cube.
(a) The diagram shows an ice cube placed on the ground.

(i) The mass of the ice cube is 3.7 g and its area of contact with the ground is 2.6 × 10⁻⁴ m2.
Calculate the pressure the ice cube exerts on the ground. (4)
pressure = ……………………………………………………..Pa
(ii) The ice cube melts and becomes a puddle with a larger cross-sectional area.
Explain how the pressure of the ice cube on the ground changes when it melts. (2)
(b) Ice melts at a temperature of 0 °C.
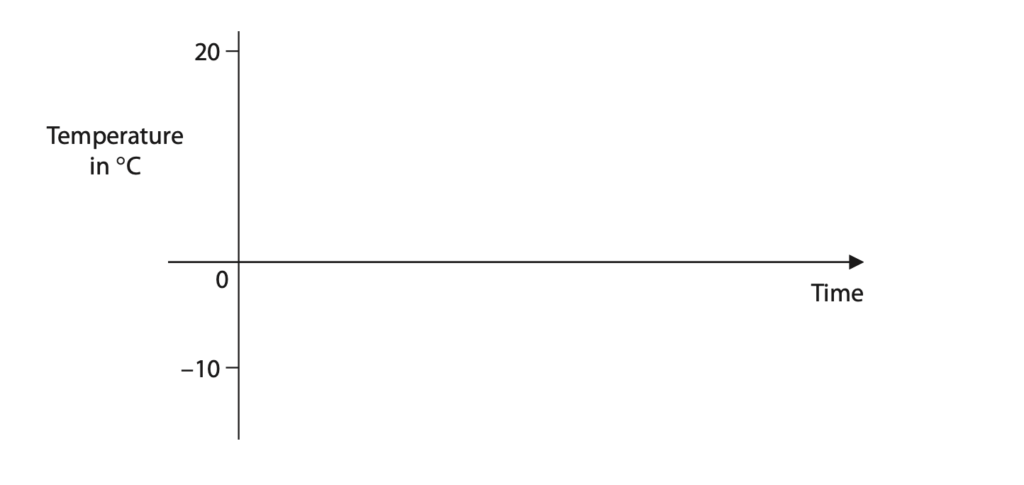
On the axes, sketch how the temperature of the ice cube changes as it rises from a temperature of –10 °C to a temperature of 20 °C. (3)
(c) Explain the changes that occur when a solid melts.
Refer to particles in your answer. (2)
Total for Question 9 = 11 marks
June 2019 Paper 2PR Q5
5. Stearic acid is a solid at room temperature and melts at a temperature of 69 °C.
A student investigates the specific heat capacity of solid stearic acid.
He heats a sample of stearic acid from room temperature using an electrical heater and measures its temperature using a data logger and temperature sensor.
The graph shows his results.
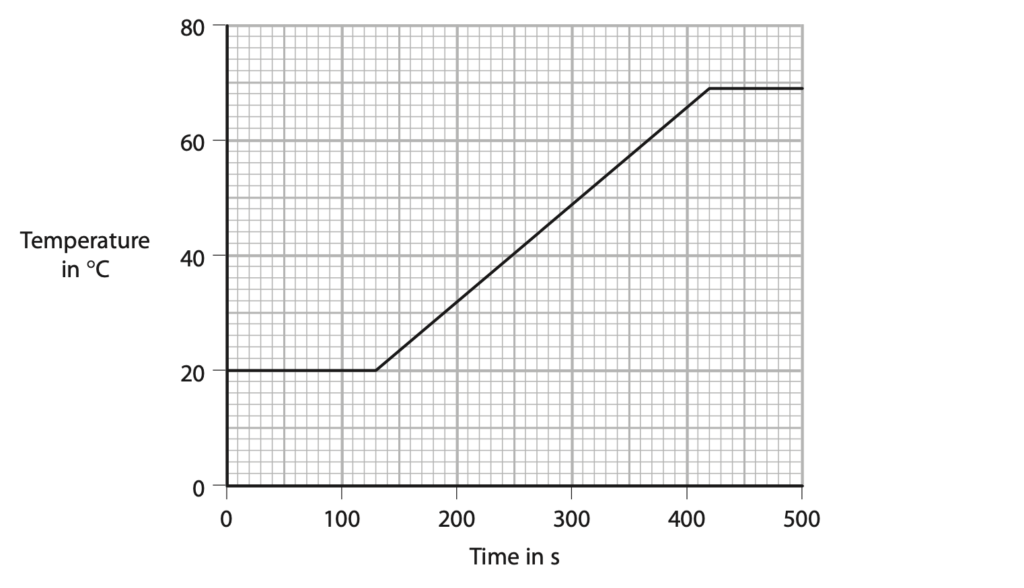
(a) The student starts heating the stearic acid at 130 seconds.
(i) Determine the time it takes to heat the stearic acid until it reaches its melting point.(1)
time = ……………………………………….. s
(ii) The stearic acid gains 39 kJ of energy during the time it is heated to its melting point.
Calculate the mean (average) power of the heater.
Give a unit with your answer.
[assume no energy lost to surroundings] (3)
mean power = ……………………………………….. unit ……………………………………….
(b) The mass of stearic acid used in the investigation is 0.45 kg.
The stearic acid gains 39 kJ of energy when it is heated to its melting point.
Calculate the specific heat capacity of stearic acid.
You should use data from the graph in your calculation. (4)
specific heat capacity = ……………………………………….. J/kg°C
Total for Question 5 = 8 marks
January 2020 Paper 1 Q4
4 A student investigates how much pressure she exerts on the ground when she is standing up.
(a) The weight of the student is 520 N.
(i) State the formula linking weight, mass and gravitational field strength (g). (1)
(ii) Calculate the mass of the student. (2)
mass = …………………………………………………….. kg
(b) The student measures the area of one of her feet when it is in contact with the ground. She draws around her foot on a piece of squared paper.
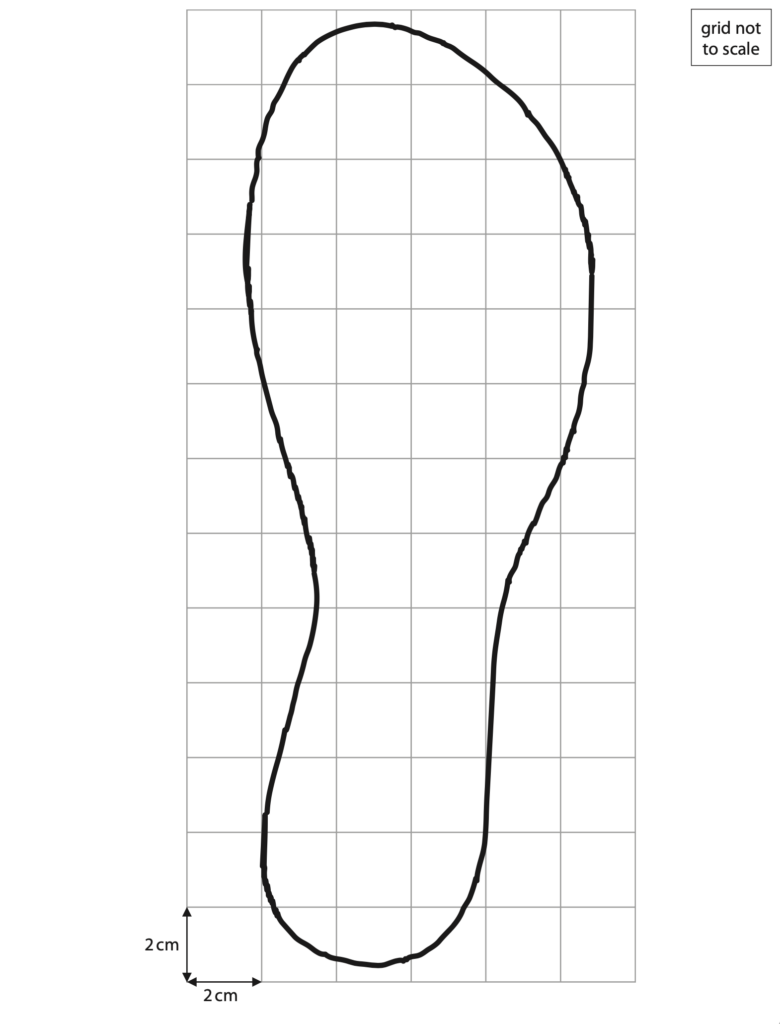
(i) The squares on the paper have a side length of 2 cm.
Estimate the area of the student’s foot in contact with the ground. (4)
area = …………………………………………………….. cm2
(ii) State the formula linking pressure, force and area. (1)
(iii) The weight of the student is 520 N.
Calculate the pressure the student exerts on the ground when she is standing on both feet.
Give the unit. (3)
pressure = …………………………………………………….. unit ……………………………………………………..
Total for Question 4 = 11 marks
January 2020 Paper 1 Q7
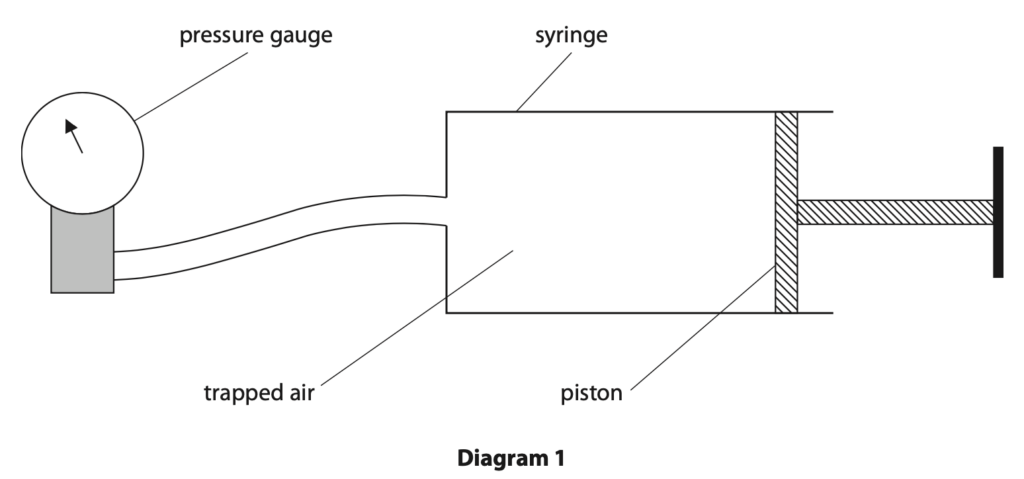
7. A student uses a syringe containing trapped air to investigate pressure.
Diagram 1 shows the apparatus he uses.
(a) Diagram 2 shows the pressure gauge when the piston is at its initial position.
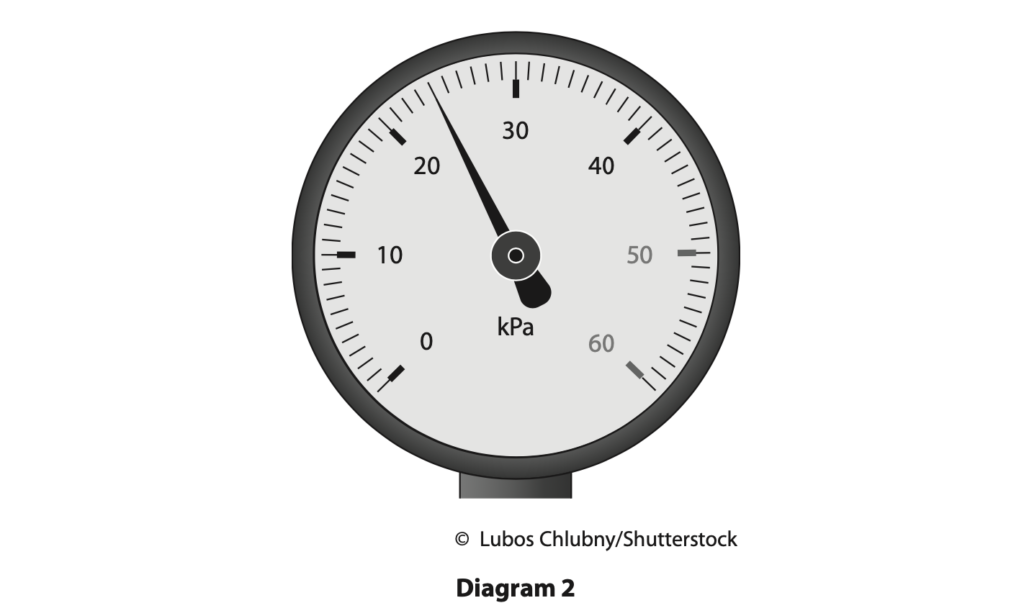
Determine the reading on the pressure gauge. (1)
pressure = …………………………………………………….. kPa
(b) The piston is pushed in so that the volume of trapped air in the syringe is halved.
The temperature of the trapped air remains constant.
Explain how the reading on the pressure gauge will change when the piston is pushed in. (3)
(c) The position of the piston is then fixed so that the volume of trapped air in the syringe is now constant.
The air in the syringe is then cooled.
(i) State how the motion of air particles inside the syringe changes when the air is cooled. (1)
(ii) Explain how the pressure of the trapped air inside the syringe changes when the air is cooled.
Refer to particles in your answer. (3)
Total for Question 7 = 8 marks
January 2020 Paper 1PR Q2
2 The diagram shows a can filled with oil.

(a) The total pressure at the bottom of the can is 110 kPa.
Atmospheric pressure is 101 kPa.
Calculate the pressure difference due to the oil. (1)
pressure difference = …………………………………………………….. kPa
(b) State the formula linking pressure difference, height, density and
gravitational field strength. (1)
(c) Calculate the height of the oil in the can. [density of oil = 960 kg/m3] (3)
height = …………………………………………………….. m
Total for Question 2 = 5 marks
January 2020 Paper 1PR Q8
8 A scientist investigates different samples of rock.
(a) The scientist wants to calculate the density of a rock sample.
She needs to measure the mass and the volume of the rock.
Describe how to obtain accurate measurements of the mass and the volume of the rock.
You may draw a diagram to support your answer. (5)
(b) The table shows the scientist’s results for rocks made from different materials.
| Material | Mass in g | Volume in cm3 | Density in g/cm3 |
| Coal | 54 | 41 | 1.3 |
| Marble | 44 | 18 | 2.4 |
| Quartz | 54 | 20 | 2.7 |
| Fluorite | 32 | 10 | 3.2 |
| Hematite | 64 | 12 | 5.3 |
(i) State the formula linking density, mass and volume. (1)
(ii) Rock X has a mass of 32g and a volume of 12cm3.
Calculate the density of rock X.
Give your answer to 2 significant figures.
density = …………………………………………………….. g/cm3
(iii) Rock X is made from the same material as one of the samples in the table.
Explain which material rock X is made from. (2)
(Total for Question 8 = 11 marks)
January 2020 Paper 1PR Q11
11 The diagram shows a model of the human breathing system.
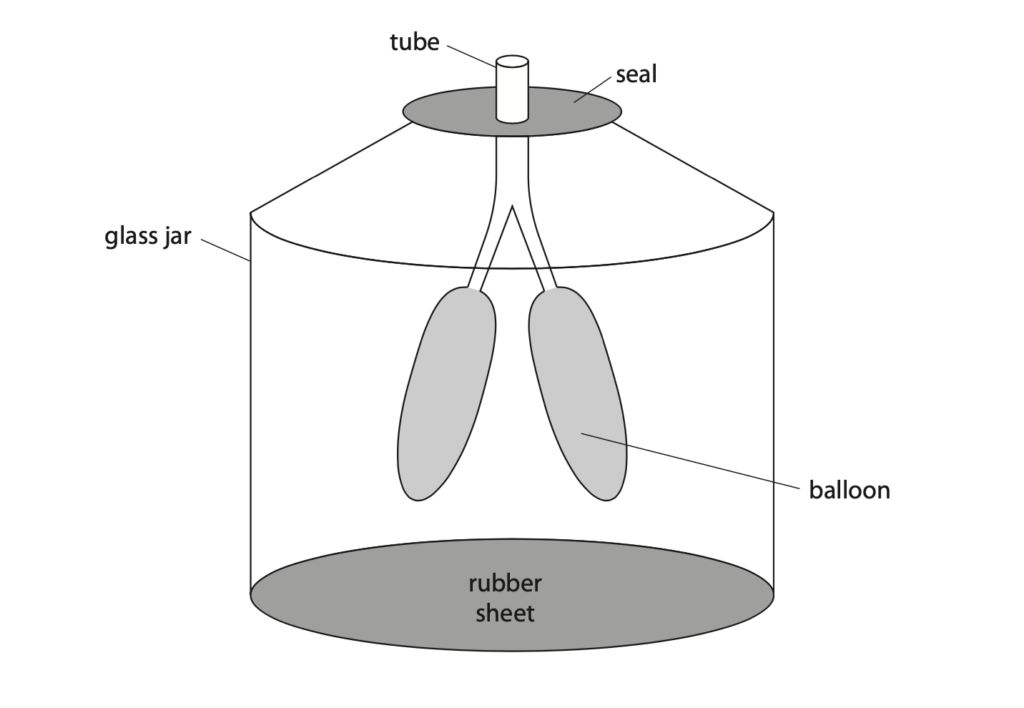
The rubber sheet is pulled downwards so that the air inside the glass jar occupies a larger volume.
The temperature of the air does not change.
(a) Explain, in terms of particles, why the pressure of the air inside the glass jar decreases. (3)
(b) Before the rubber sheet is pulled down, the air inside the jar is at atmospheric pressure.
The volume of gas inside the jar increases from 110 cm3 to 140 cm3.
Calculate the pressure inside the jar after the rubber sheet is pulled down.
[atmospheric pressure = 101 kPa] (3)
pressure = …………………………………………………….. Pa
(c) The jar is sealed, but the balloons are open to the atmosphere.
Before the rubber sheet is pulled down, the air inside the balloons is at atmospheric pressure.
Explain why the balloons start to expand when the rubber sheet is pulled down. (3)
(Total for Question 11 = 9 marks)
January 2020 Paper 2P Q2
2 The photograph shows a brass mass.

(a) State the formula linking density, mass and volume. (1)
(b) The brass mass has a mass of 454 g.
The density of brass is 8.46 g/cm3.
Calculate the volume of the brass mass. Give the unit. (3)
volume = …………………………………………………….. unit ……………………………………………………..
Total for Question 2 = 4 marks
January 2020 Paper 2PR Q5
5 A student does an investigation to determine the temperature-time graph for water as it changes state from ice to liquid water.
The diagram shows the student’s apparatus.
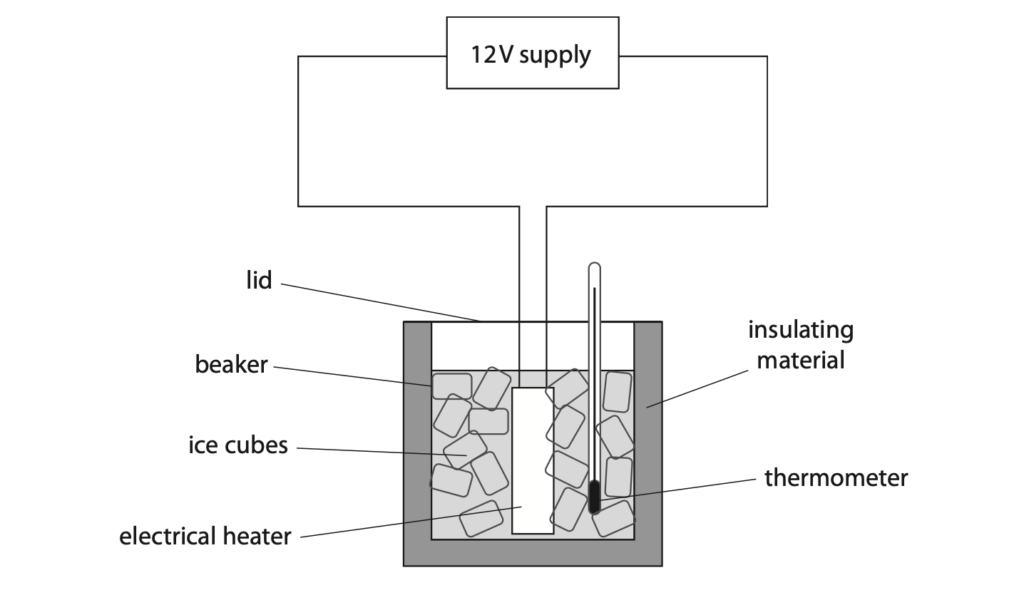
The ice has an initial temperature of –17 °C.
After 5 minutes, the ice begins to melt.
After a further 6 minutes, all the ice has melted.
The investigation continues for a total time of 20 minutes.
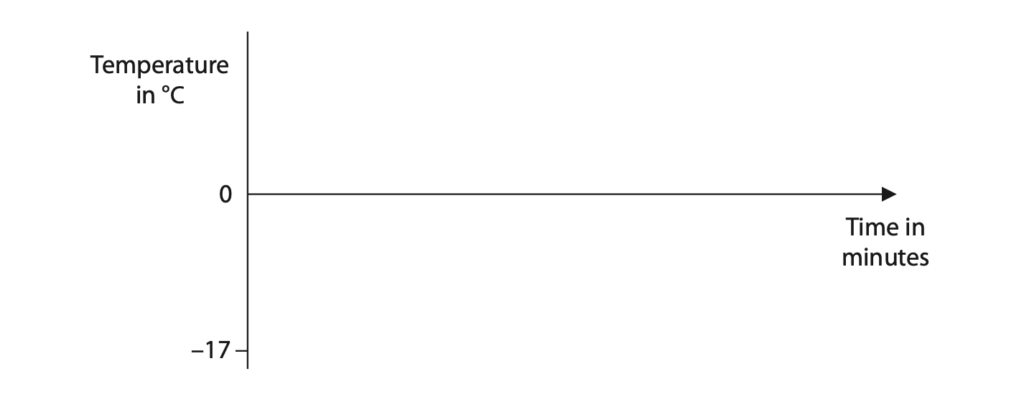
(a) (i) Sketch a graph on the axes to show how the temperature changes with time.
Assume that the rate of energy transfer from the heater to the ice cubes is constant. (3)
(ii) Suggest a precaution the student should take to obtain high quality data. (1)
(b) During the experiment the heater transfers 2500 J of energy to the beaker.
The beaker has a specific heat capacity of 880 J / kg °C and a mass of 48 g.
Calculate the increase in the temperature of the beaker. (3)
temperature increase = ……………………………………………… °C
(Total for Question 5 = 7 marks)
June 2020 Paper 1PR Q6
6 A student needs to identify a sample of an unknown liquid.
She decides to do this by finding the density of the liquid.
(a) Describe how the student should measure the mass of the liquid. (2)
(b) Describe how the student should use a measuring cylinder to obtain an accurate measurement of the liquid’s volume. (2)
(c) The table gives the values of the densities for some liquids.
| Liquid | Density in g/cm3 |
| Brine | 1.23 |
| Glucose | 1.44 |
| Olive oil | 0.82 |
| Pure water | 1.00 |
| Sodium hydroxide | 1.25 |
| Sunflower oil | 0.92 |
The student measures the mass of the sample of unknown liquid as 150 g and the volume as 163 cm3.
Deduce the name of the unknown liquid. (3)
(Total for Question 6 = 7 marks)
June 2020 Paper 1PR Q13
13 This question is about pressure in gases.
(a) Photograph 1 shows an open conical flask containing air.
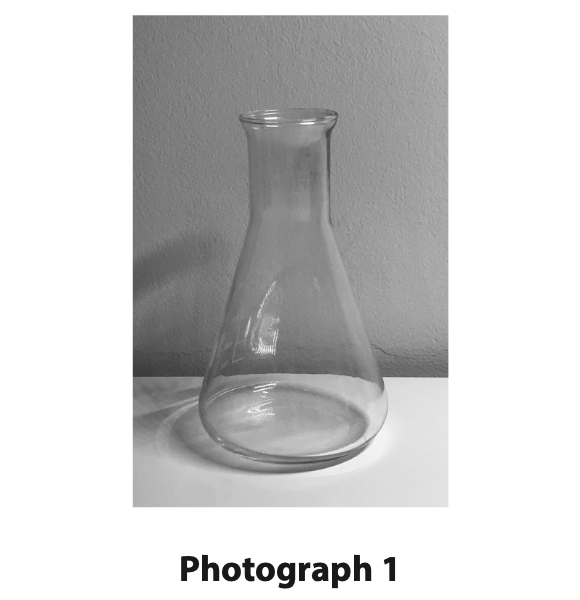
The air in the flask is heated to a temperature of 85 °C.
(i) Calculate the temperature of the air in the flask in kelvin. (1)
temperature = ……………………………………………………………………….. K
(ii) Describe how the motion of the molecules in the flask changes when the temperature of the air inside the flask increases. (2)
(iii) The pressure of the air in the flask does not change when the temperature of the air increases.
State what happens to the number of air molecules in the flask when the temperature of the air inside the flask increases. (1)
(b) Photograph 2 shows a boiled egg, without its shell, placed in the top of the conical flask containing hot air.
The flask is no longer being heated.
The egg seals the flask so that no air escapes.
Photograph 3 shows the egg and the flask a short time later.
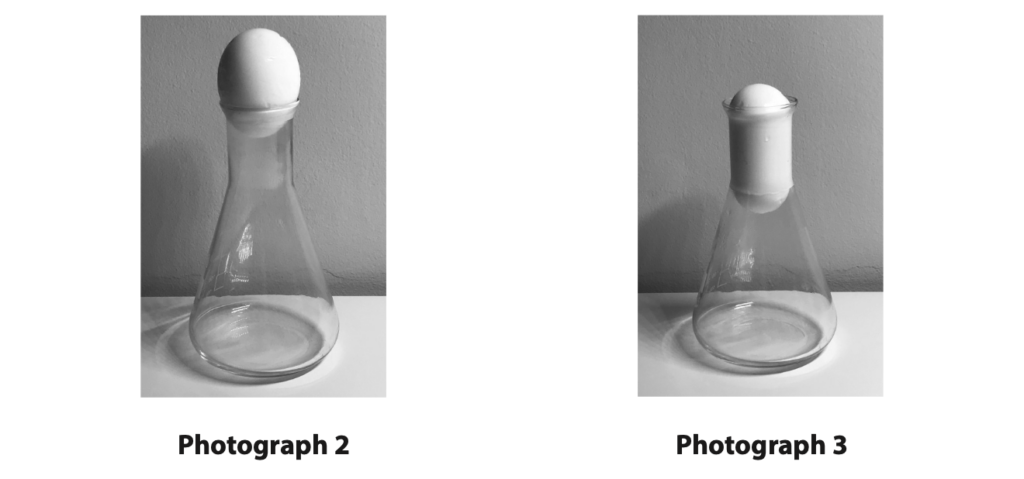
Explain why the egg moves down into the flask and then stops moving. Refer to ideas about pressure in your answer. (4)
(Total for Question 13 = 8 marks)
June 2020 Paper 2P Q1
1. This question is about liquid nitrogen.
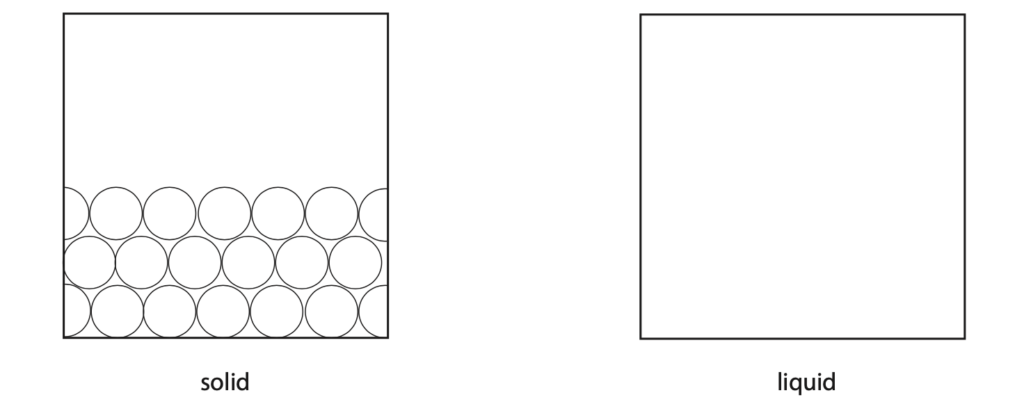
(a) (i) The diagram shows the arrangement of particles in solid nitrogen.
Draw the arrangement of particles in liquid nitrogen. (2)
(ii) Describe the motion of the particles in liquid nitrogen. (1)
(b) A teacher uses this method to find the density of liquid nitrogen.
- measure the mass of a container
- pour liquid nitrogen into the container
- measure the total mass of the container and the liquid nitrogen
- read the volume of the liquid nitrogen from the scale on the side of the container
(i) Give a safety precaution the teacher should take when pouring the liquid nitrogen. (1)
(ii) State the name of the apparatus that the teacher should use to measure the mass
of the container. (1)
(iii) The table shows the teacher’s results.
| mass of container in g | 75 |
| mass of container + liquid nitrogen in g | 149 |
| volume of liquid nitrogen in cm3 | 88 |
Calculate the mass of liquid nitrogen in the container. (1)
mass = ……………………………………………….. g
(iv) State the formula linking density, mass and volume. (1)
(v) Calculate the density of the liquid nitrogen. (3)
Give a suitable unit.
density = ………………………………………………… unit = ………………………………
(c) Over time, the liquid nitrogen warms up and changes state from a liquid into a gas.
Describe the changes to the arrangement and motion of particles when the liquid nitrogen changes state. (3)
(Total for Question 1 = 13 marks)
June 2020 Paper 2PR Q6
6 Conventional power stations burn fuel in a furnace.
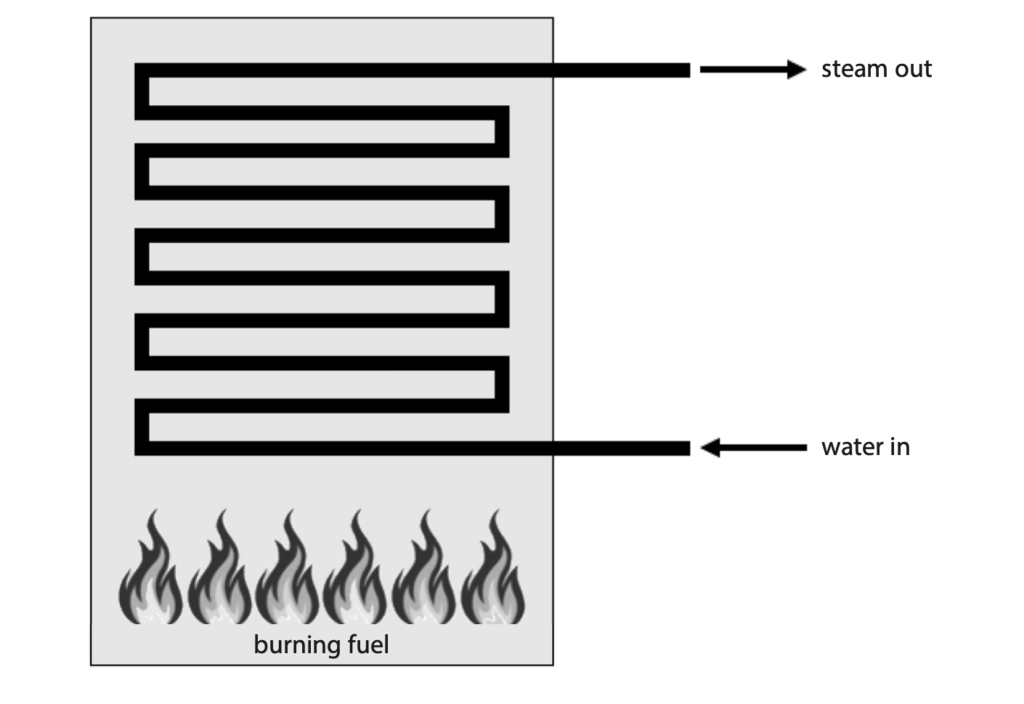
(a) The fuel can be a solid, a liquid or a gas.
Describe the motion of particles in a solid, a liquid and a gas. (3)
Solid
Liquid
Gas
(b) When the fuel is burned, energy is transferred from the fuel to the water.
The water boils and turns into steam.
(i) Describe how energy stored in the fuel is transferred to the water.
Refer to energy stores and transfers in your answer. (3)
(ii) The temperature-time graph shows how the temperature of the water changes as it is heated in the furnace at a constant rate.
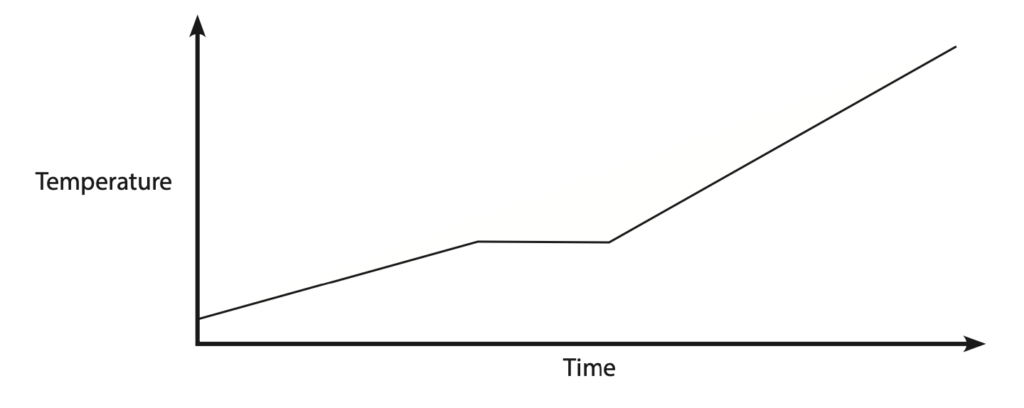
Explain how the graph shows that the water changes state as it is heated. (2)
(Total for Question 6 = 8 marks)
January 2021 Paper 1P Q8
8. A student uses a computer simulation to investigate the motion of particles in a gas.
He records the pressure of the gas and the mean speed of the particles in the gas at different temperatures.
The graphs show his results.
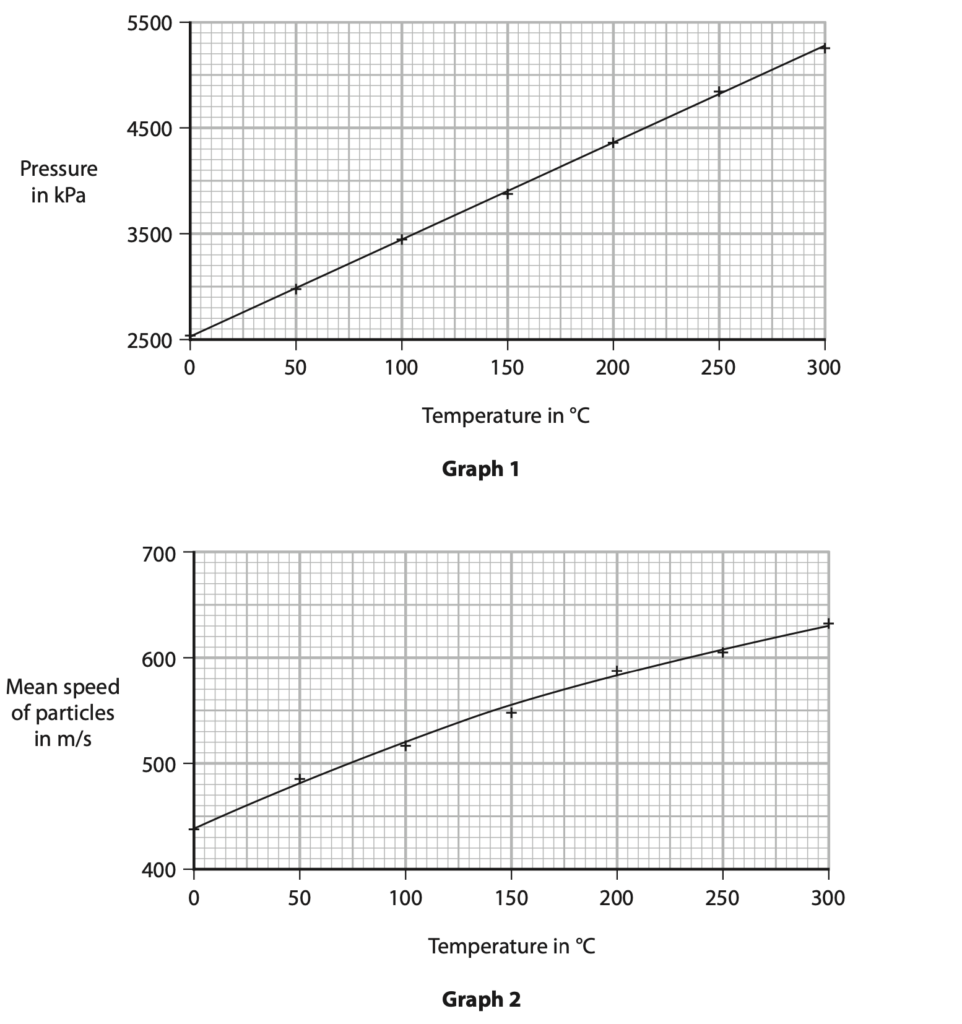
(a) Give a reason why the student does not start the y-axis scale from zero on either of his graphs. (1)
(b) Describe the relationships shown by the graphs. (3)
(c) Explain why the value of temperature chosen in the simulation should not decrease below – 273 °C. (2)
(d) The student then calculates the kinetic energy of a single gas particle at each temperature.
(i) Using the curve of best fit on graph 2, determine the mean speed of a gas particle when the gas temperature is 100 °C. (1)
mean speed = …………………………………………………… m/s
(ii) The mass of a single gas particle is 5.3 × 10⁻²⁶ kg.
Calculate the average kinetic energy of a gas particle when the temperature of the gas is 100 °C. (3)
kinetic energy = …………………………………………………… J
(iii) Calculate the temperature of the gas in kelvin when its temperature is 100 °C. (1)
temperature = …………………………………………………… K
(iv) On the axes, sketch a graph of the average kinetic energy of the gas particles against temperature in kelvin.
(Total for Question 8 = 13 marks)
January 2021 Paper 1P Q11
11 A student uses a bottle and a stopper to find the density of an unknown liquid.
The stopper fits tightly into the bottle and has a small diameter hole through it.

(a) This is the student’s method.
- use a balance to find the mass of the bottle and stopper
- completely fill the bottle with water
- insert the stopper and dry the outside of the bottle
- use the balance to find the mass of the full bottle and stopper
These are the student’s results.
mass of empty bottle and stopper = 63.4 g
mass of full bottle and stopper = 112.9 g
Use the student’s results to determine the volume of the water in the bottle.
Give your answer to three significant figures. (4)
[density of water = 0.998 g/cm3]
volume = …………………………………………………… cm3
(b) The student empties the bottle and then dries it.
He refills the bottle with the unknown liquid.
He measures the mass of the full bottle and stopper as 143.8 g.
Calculate the density of the unknown liquid. (3)
density of unknown liquid = …………………………………………………… g/cm3
(c) Another student uses a measuring cylinder to find the volume of the unknown liquid.
Discuss the advantages and disadvantages of using each method to find the volume of the unknown liquid. (3)
(Total for Question 11 = 10 marks)
January 2021 Paper 1PR Q4
4 The diagram shows apparatus used to investigate how the pressure of a gas varies with temperature.
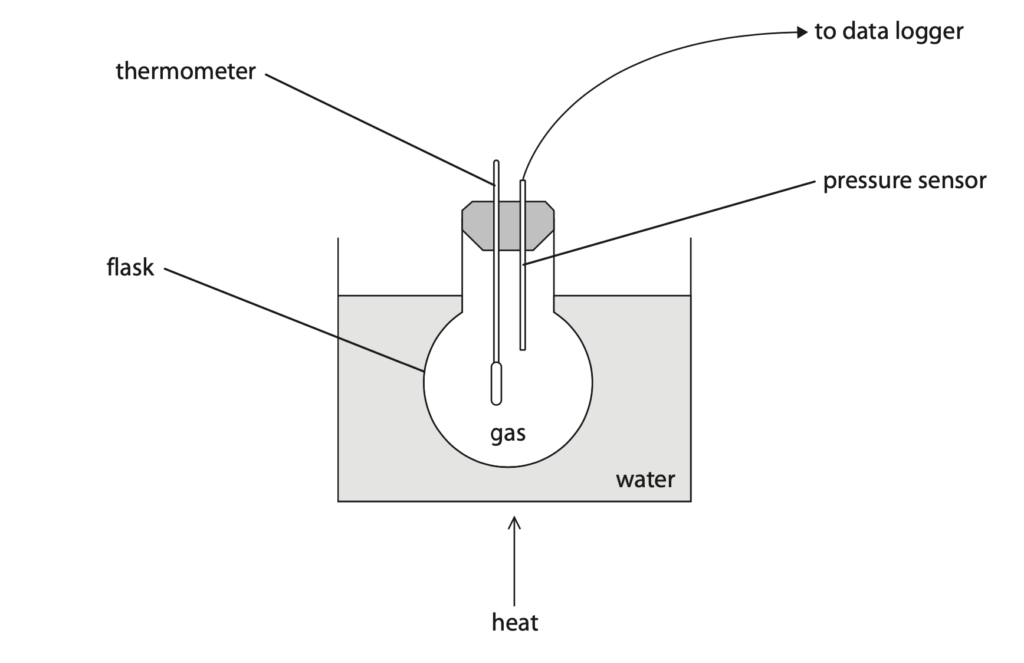
(a) The volume of the gas is kept constant by the flask.
The volume of the gas is a control variable.
State why it is important to keep a control variable constant throughout the investigation. (1)
(b) The pressure of the gas changes as its temperature increases. The graph shows the results.
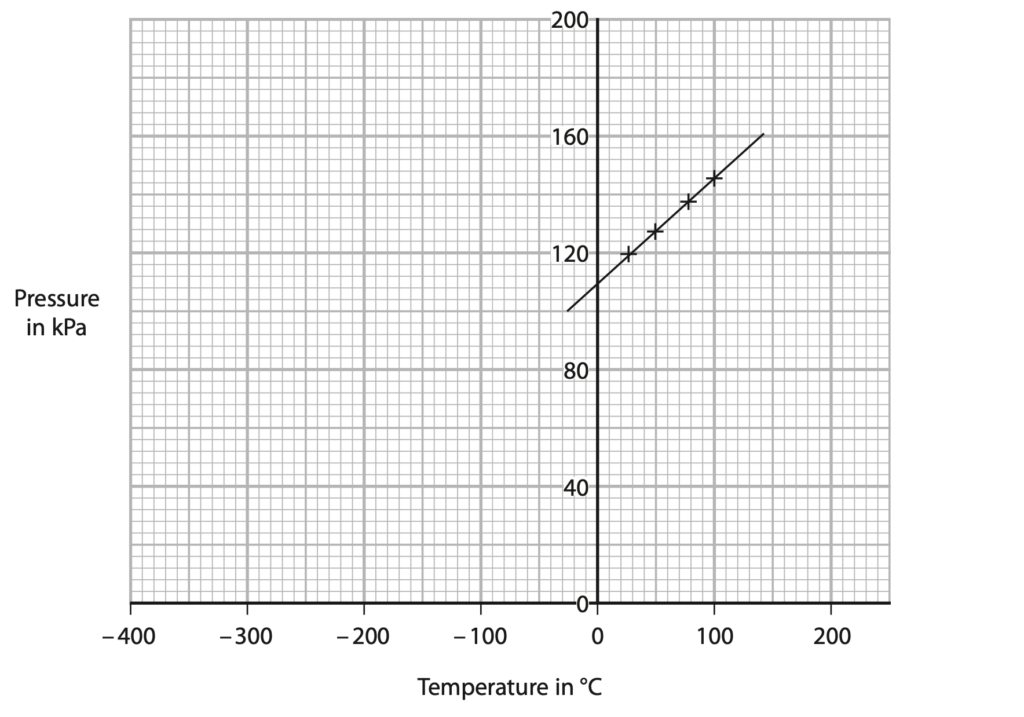
(i) Explain how these results show that there is a linear, but not proportional, relationship between the pressure of the gas and its temperature in °C. (2)
(ii) Use the graph to determine the value for absolute zero. (2)
temperature = …………………………………………………….. °C
(iii) Explain how the pressure of the gas changes as its temperature increases. Include ideas about particles in your answer. (3)
(c) The pressure of the gas is 112kPa when its temperature is 35°C.
The gas is heated to 340 °C using some different apparatus.
(i) Calculate the pressure of the gas when its temperature is 340 °C.
Assume the gas has a constant volume. (4)
pressure = …………………………………………………….. kPa
(ii) The volume of the gas is constant in the investigation.
Give the name of the other quantity that must be constant for the calculation to be correct. (1)
(Total for Question 4 = 13 marks)
Jan 2021 Paper 1PR Q7
7 A glass contains fizzy water.
Bubbles of carbon dioxide form at the bottom of the glass and rise to the surface.
(a) The graph shows the relationship between the volume of a bubble and the pressure of the gas in the bubble.
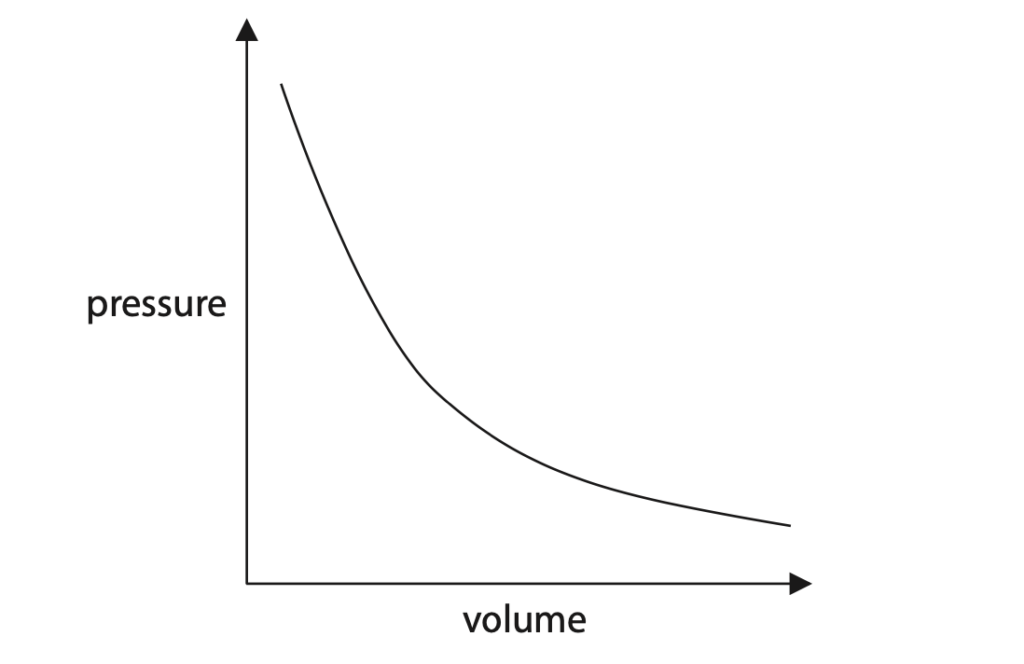
(i) Describe the relationship shown by the graph. (2)
(ii) State the formula linking pressure difference, height, gravitational field strength and density. (1)
(iii) The depth of the fizzy water in the glass is 22 cm.
The density of the fizzy water is 1080 kg/m3.
Calculate the pressure difference at the bottom of the glass due to the fizzy water. (2)
pressure difference = …………………………………………………….. Pa
(iv) Calculate the pressure of the gas in the bubble when the bubble is at the bottom of the glass. (1)
[atmospheric pressure = 101 000 Pa]
pressure = …………………………………………………….. Pa
(v) When a bubble is at the top of the glass, the pressure of the gas in the bubble is equal to 101 000 Pa and the bubble has a volume of 0.084 cm3.
Calculate the volume of the gas in the bubble when the bubble is at the bottom of the glass.
Assume the temperature of the gas remains constant. (3)
volume = …………………………………………………….. cm3
(b) A force called upthrust acts vertically upwards on the bubble. When the bubble is released, it accelerates vertically upwards.
Draw two labelled arrows on the diagram to show the forces on the bubble as it is released. (3)

(Total for Question 7 = 12 marks)
January 2021 Paper 2PR Q1
1 The diagram shows the temperature-time graph for a substance which is heated at a constant rate.
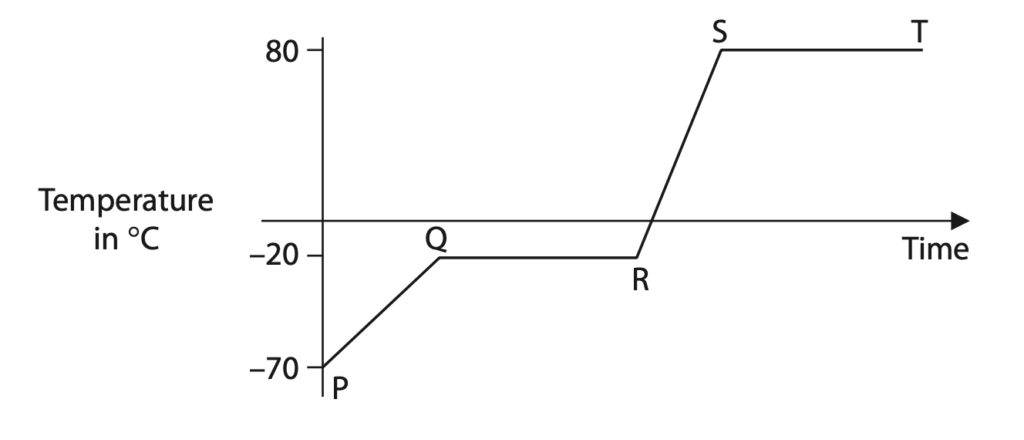
(a) (i) Which section of the graph shows when the substance is melting? (1)
A PQ
B QR
C RS
D ST
(ii) Which section of the graph shows when all the substance is a solid? (1)
A PQ
B QR
C RS
D ST
(iii) Draw particles in the box to show the arrangement of particles when the substance is a gas. (1)

(iv) Which of these statements best describes the motion of particles in a gas? (1)
A they vibrate about fixed points
B they are stationary
C they slide past each other
D they move quickly and randomly
(b) (i) Name a piece of apparatus that could be used to measure the temperature of the substance. (1)
(ii) Determine the boiling point of this substance. (1)
boiling point = …………………………………………………….. °C
(c) The substance has a mass of 1.2kg.
Calculate the energy required to raise the temperature of the substance from 10°C to 37°C. (3)
[assume specific heat capacity of substance = 840 J/kg °C]
energy = …………………………………………………….. J
(Total for Question 1 = 9 marks)
2022 Paper 1P Q11
11 Scientific balloons are tested in a laboratory before they are used.
(a) In the first test the pressure of the air inside the balloon is 120 kPa.
The balloon is sealed and has a volume of 92 m3.
(i) The pressure of the air inside the balloon is reduced to 64 kPa by reducing the external air pressure.
Calculate the new volume of the balloon. (2)
volume = …………………………………………………….. m3
(ii) Give an assumption that is made in the calculation. (1)
(b) The pressure of the air in the balloon is returned to 120 kPa.
The temperature of the air inside the balloon is 290 K.
The balloon is tested again, changing the temperature of the air and keeping the volume of the balloon constant.
(i) Explain why the pressure of the air in the balloon decreases when the temperature of the air decreases. (3)
(ii) Calculate the temperature of the air when the pressure of the air in the balloon is 64 kPa.
Give your answer in kelvin. (3)
temperature = …………………………………………………….. K
(Total for Question 11 = 9 marks)
2022 Paper 1PR Q11
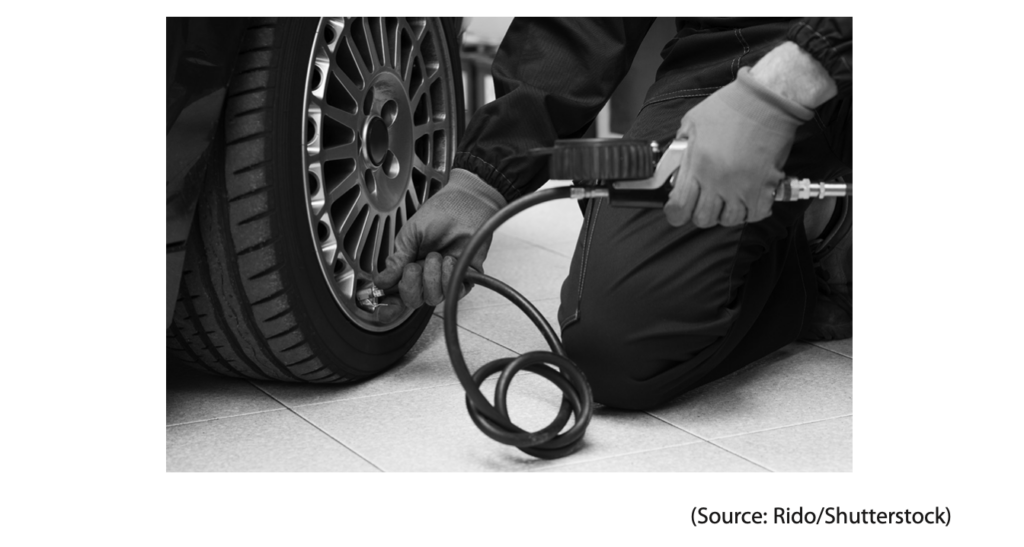
11 The photograph shows a mechanic pumping air into a car tyre.
(a) Before being pumped into the tyre, some air has a volume of 0.0043 m3 at a pressure of 100 kPa.
The pressure of this air inside the tyre is 270 kPa.
Calculate the volume of this air inside the tyre, assuming the temperature of the air does not change.
Give your answer in standard form. (3)
volume = …………………………………………………….. m3
(b) The car is fitted with a tyre pressure monitoring system.
A warning light will show in the car if the air pressure in the tyre falls below 250 kPa.
(i) Using ideas about particles, explain why the air pressure inside the tyre is lower on a cold winter day than on a warm summer day. (3)
(ii) The air pressure in the tyre is 270 kPa when the air temperature is 20 °C. On a cold winter day, the temperature is 2 °C.
Determine whether the tyre pressure warning light will show in the car on the cold winter day. (4)
[assume tyre volume does not change]
(Total for Question 11 = 10 marks)
2022 Paper 2P Q2
2 (a) Describe the arrangement and motion of particles in a solid. You may draw a diagram to help your answer. (3)
(b) A solid changes state by melting at a certain temperature.
For phosphorus, this change of state occurs at 44 °C.
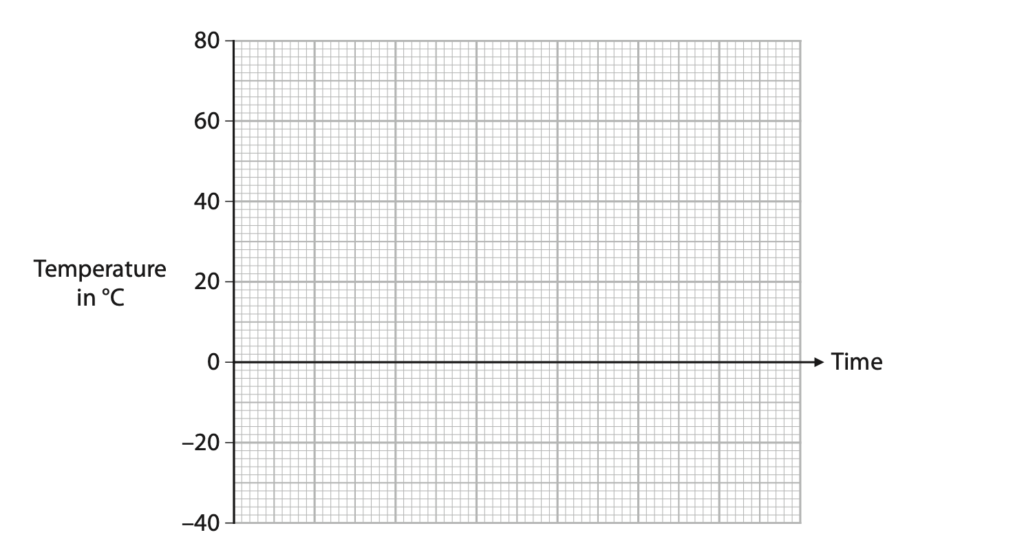
Sketch how the temperature of a sample of phosphorus changes when it is heated at a constant rate from –40 °C to 80 °C. (3)
(Total for Question 2 = 6 marks)


