IGCSE Physics Waves Past Papers Exam Questions (Edexcel): 2019-20
We analysed the Pearson Edexcel International GCSE past papers and grouped the questions by topic. Here, you will find questions relating to the topic – Waves. Use these to familiarise, practice and prepare for your IGCSE Physics examination.
You can find more IGCSE Physics Past Year Questions by the Wave topic below:
- Waves Past Papers from 2019 to 2020
- Waves Past Papers from 2021 to 2022
- Waves Past Papers from 2023 to 2024
What you need to know
Use the list below as a quick recap for what you need to know before attempting the past year exam questions under this topic. This is based on Edexcel International GCSE in Physics (4PH1) specification with first teaching Sept 2017 and first examination June 2019.
Paper 1 and 2: (3) Waves
Paper 1 covers all the topics except where it is marked “paper 2 only” while Paper 2 covers all topics.
A. Units
- degree (°), hertz (Hz), metre (m), metre/second (m/s) and second (s)
B. Properties of waves
- explain differences between longitudinal and transverse waves.
- definitions of amplitude, wavefront, frequency, wavelength and period of a wave.
- waves transfer energy and information without transferring matter.
- the relationship between wave speed, wavelength and frequency. v=f×λ
- the relationship between frequency and time period. f=1/T
- use the relationships above in different contexts
- the Doppler effect: change in observed frequency and wavelength when its source is moving relative to observer
- that all waves are reflected and refracted
C. The electromagnetic spectrum
- that light is part of a continuous electromagnetic spectrum: radio, microwave, infrared, visible, ultraviolet, x-ray, gamma ray.
- that all these waves travel at the same speeds in free space
- the order of electromagnetic spectrum by wavelength and frequency (decreasing wavelengths, increasing frequency, colours of visible spectrum)
- explain the uses of electromagnetic radiations: radio waves (broadcasting, communications), microwaves (cooking, satellite transmissions), infrared (heaters, night vision), visible light (optical fibres, photography), ultraviolet (fluorescent lamps), x-ray (observe internal structure, medical), gamma rays (sterilising food, medical equipment)
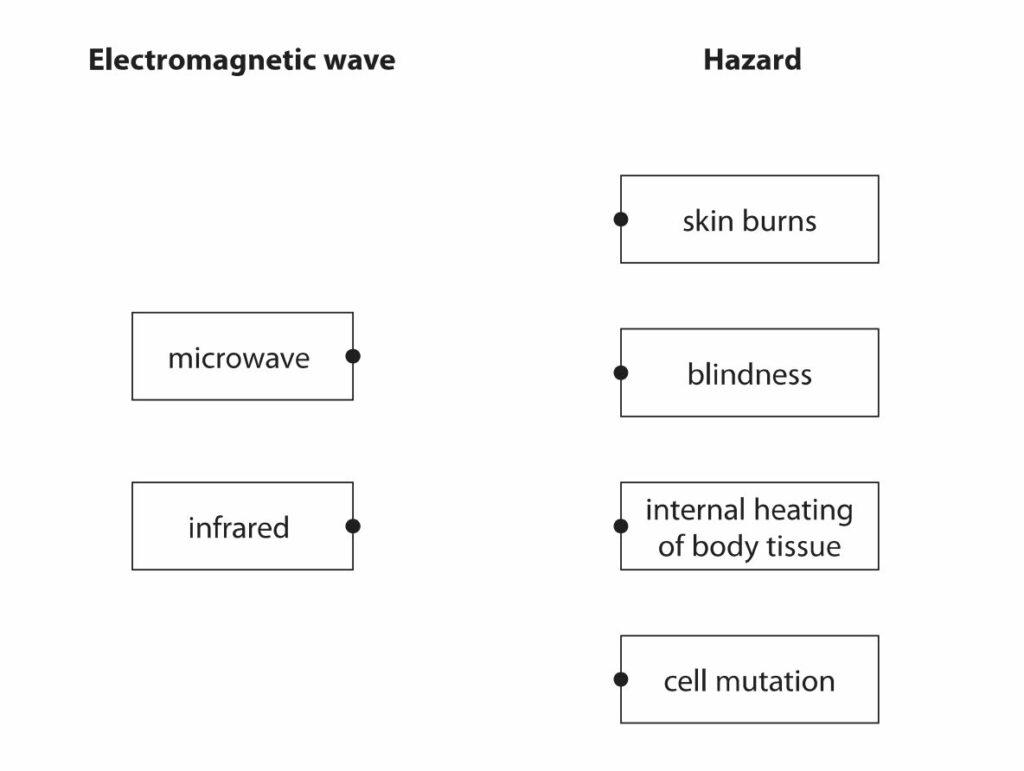
- explain the detrimental effects of the electromagnetic waves: microwave (internal heating of body tissue), infrared (skin burns), ultraviolet (damage to surface cells and blindness), gamma ray (cancer, mutation). Describe protective measures.
D. Light and sound
- that light waves are transverse waves and can be reflected and angle of refracted
- use the law of reflection. (angle of incidence = angle of reflection)
- draw ray diagrams to show reflection and refraction
- investigate the refraction of light
- the relationship between refractive index and the angle of incidence and angle of refraction. n = sin i / sin r
- investigate the refractive index using glass block
- describe the role of total internal reflection in optical fibres and prisms
- explain the meaning of critical angle, c
- relationship between critical angle and refractive index. sin c = 1 / n
- sound waves are longitudinal and can be reflected and refracted
(paper 2 only)
- range of human hearing 20-20000Hz
- investigate the speed of sound in air
- how an oscilloscope and a microphone can display sound waves
- investigate the frequency of sound with an oscilloscope
- that pitch of sound relates to frequency of the source vibration
- that loudness relates to the amplitude of the source vibration
June 2019 Paper 1 Q1
1. This question is about waves
(i) Which of these waves is longitudinal? (1)
A infrared
B radio
C sound
D ultraviolet
(ii) Draw a straight line linking each electromagnetic wave to its correct hazard.(2)
(b) (i) Which of these is a use for x-rays? (1)
A checking for broken bones
B cooking food
C detecting forged banknotes
D smoke detectors
(ii) Which of these is a use for infrared waves? (1)
A checking for broken bones
B cooking food
C detecting forged banknotes
D sterilising medical instruments
Total for question 1 = 5 marks
June 2019 Paper 1 Q7
7 This question is about refraction.
(a) State what is meant by the term refraction. (1)
(b) The diagram shows a ray of light from a torch incident on the surface of a pool of water.
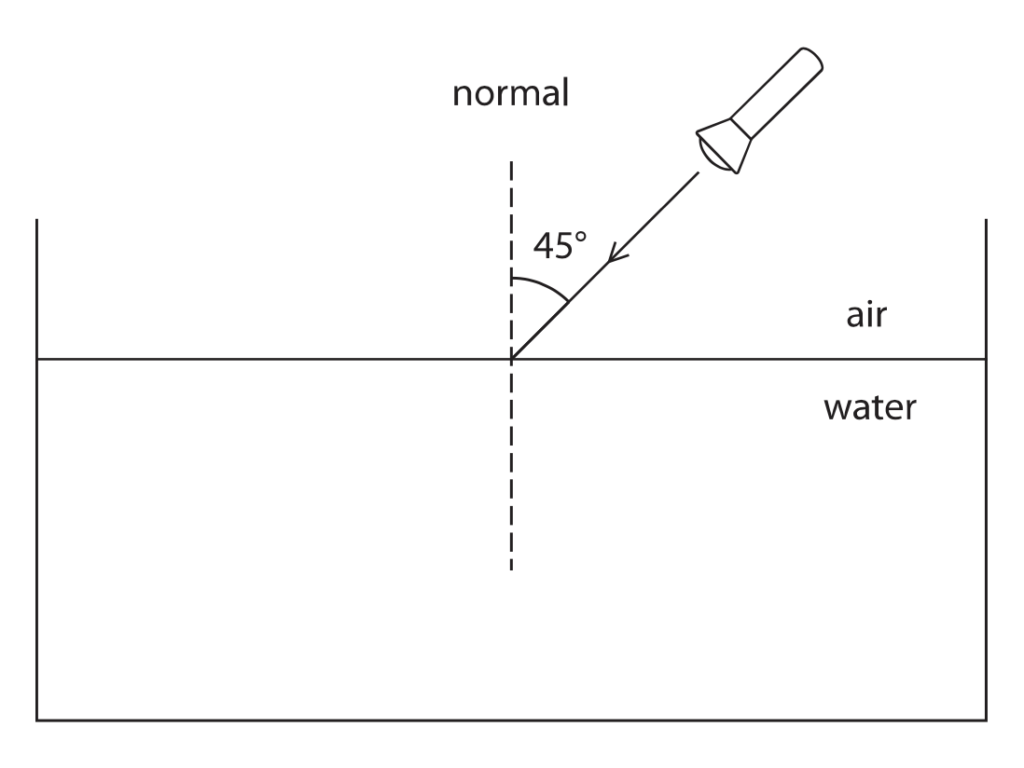
The angle of refraction of the ray of light is 33o
(i) Draw the path of the ray of light in the water.(2)
(ii) State the formula linking refractive index, angle of incidence and angle of refraction.(1)
(iii) Show that the refractive index of water is about 1.3 (2)
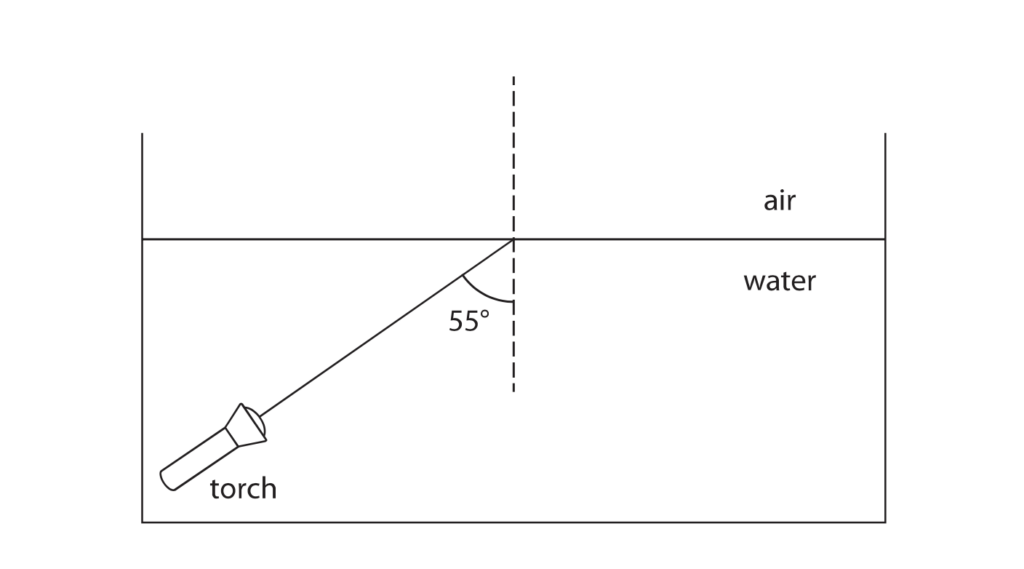
(c) The torch is moved below the surface of the water. Light from the torch is incident on the water surface at an angle greater than the critical angle.
(i) Explain the meaning of the term critical angle.
You may draw a diagram to help your answer.(2)
(ii) State the formula linking critical angle and refractive index.(1)
(iii) Calculate the critical angle of water.
Assume the refractive index of water is 1.3 (3)
(iv) A ray of light leaves the torch as shown in the diagram.
Complete the path of the ray of light.(2)
Total for Question 7 = 14 marks
June 2019 Paper 1PR Q9
9 (a) A light ray travels from air into water.
Diagram 1 shows the direction of the light ray and the wavefronts in air.
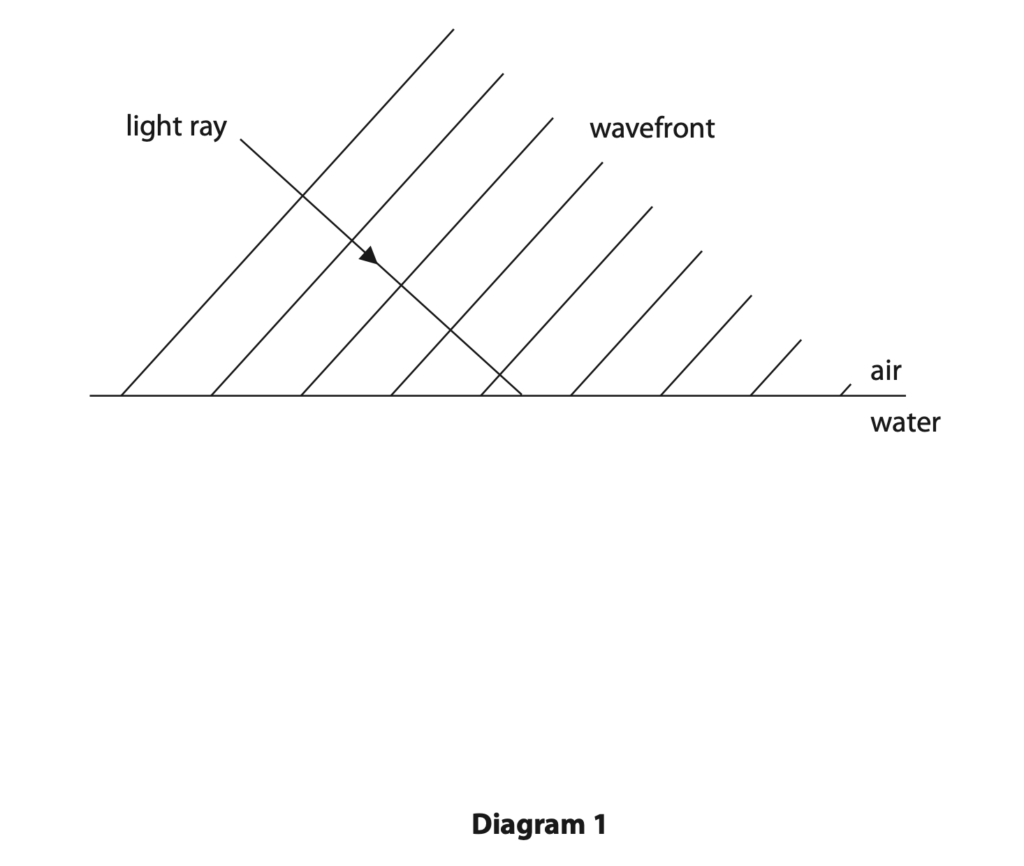
The refractive index of water is greater than the refractive index of air.
(i) Complete diagram 1 by showing (3)
- the wavefronts in the water
- the path of the light ray in the water
(ii) Explain what happens to the wavelength of light when it passes from air into water.
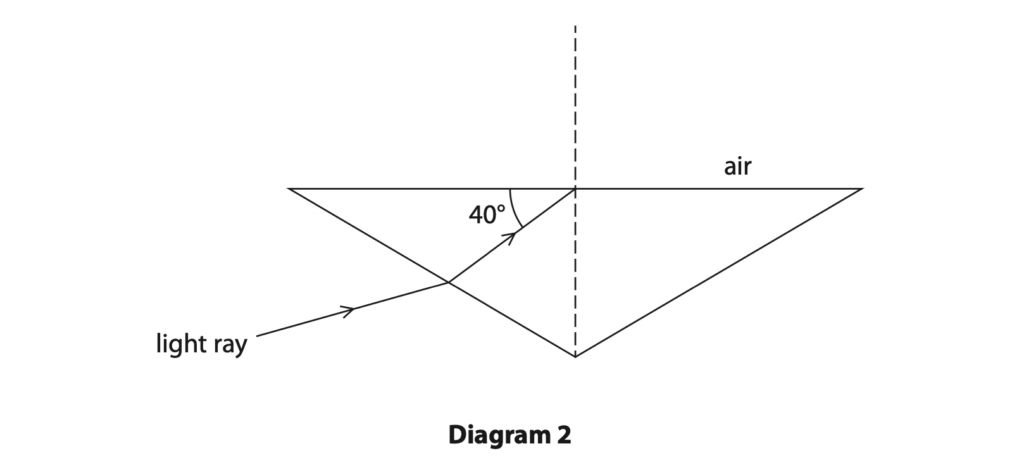
(b) Diagram 2 shows what can happen when a light ray travelling in glass meets the boundary with air. (2)
The wavefronts are not shown in this diagram
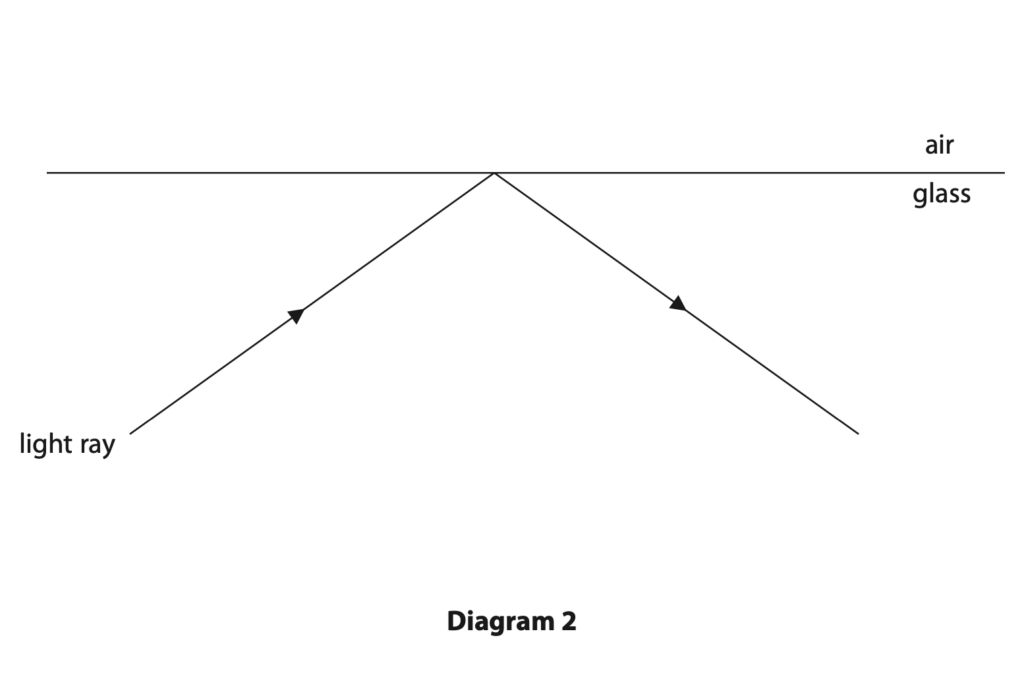
(i) Add the normal to diagram 2. (1)
(ii) Measure the angle of incidence in diagram 2. (1)
angle of incidence = ………………………………………… degrees
(iii) The glass has a refractive index of 1.6
Calculate the critical angle of the glass-air boundary. (3)
critical angle = ……………………………………….. degrees
(iv) Explain the path of the light ray shown in diagram 2. (3)
Total for Question 9 = 13 marks
June 2019 Paper 2P Q3
3. This question is about sound waves.
(a) Describe an experiment to measure the speed of sound in air.
You may draw a diagram to help your answer. (5)
(b) An oscilloscope can be used to determine the frequency of a sound wave.
The diagram shows an oscilloscope trace of a sound wave.
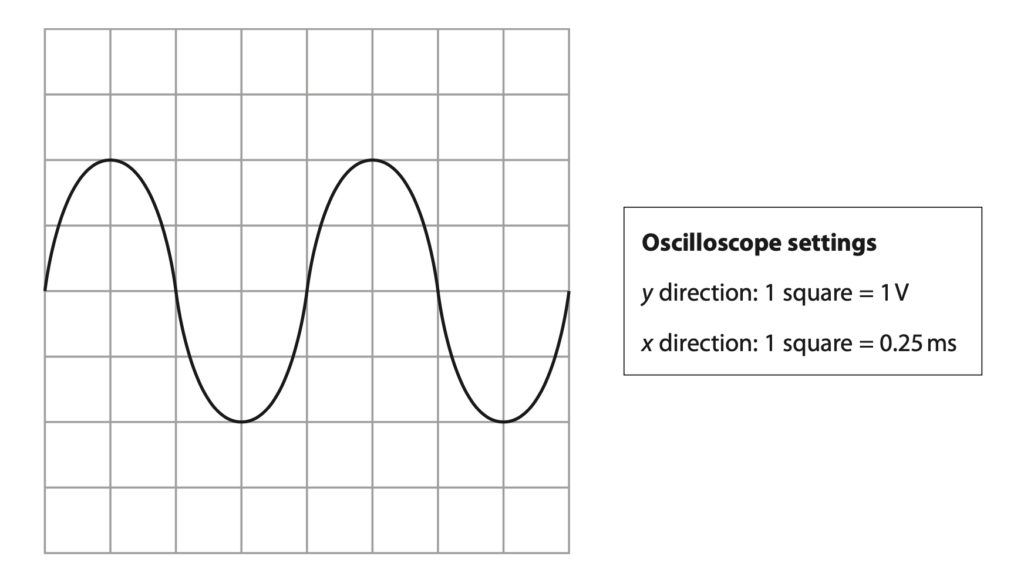
(i) Calculate the period of this sound wave. (3)
period = …………………………………………………….. s
(ii) Calculate the frequency of this sound wave. (2)
frequency = …………………………………………………….. Hz
Total for Question 3 = 10 marks
June 2019 Paper 2 Q5
5. A toy produces continuous waves when floating on the surface of a pool of water.
The waves spread out as circular wavefronts.
Diagram 1 shows the wavefronts produced when the toy is not moving, as viewed from above.

Diagram 2 shows the wavefronts produced when the toy is moving across the surface of the pool of water.

(a) Draw an arrow on diagram 2 to show the direction the toy is moving (1)
(b) Explain how the frequency of the waves at point A is different to the frequency of the waves at point B. (4)
Total for Question 5 = 5 marks
June 2019 Paper 2PR Q2
2 This question is about sound waves.
(a) Sound is an example of a type of wave.
State the name of this type of wave. (2)
(b) The speed of sound in liquids is greater than the speed of sound in gases.
(i) Describe the arrangement of particles in liquids and in gases.
You may use diagrams to help your answer. (2)
(ii) Suggest why the speed of sound in liquids is greater than the speed of sound in gases. (2)
(c) A buzzer is an electrical device that produces sound.
The frequency of sound produced by the buzzer is 1400Hz.
(i) State the formula linking speed, frequency and wavelength of a wave. (1)
(ii) Sound travels at a speed of 340 m/s in air.
Calculate the wavelength of the sound wave from the buzzer. (2)
wavelength = ……………………………………….. m
(iii) Two students use this method to investigate sound from a moving source.
Student A connects a piece of string to the buzzer.
She spins round so that the buzzer moves in a horizontal circular path.
- she spins round at a slow speed
- she then spins round at a high speed
Student B stands several metres away from student A.

The sound heard by student A is different to the sound heard by student B. Discuss the differences in the sounds heard by student A and student B. (5)
Total for Question 2 = 13 marks
January 2020 Paper 1 Q9
9 A teacher investigates the penetrating ability of the gamma rays from a gamma source.
This is the teacher’s method.
- place the gamma source at a distance of 25 cm from a radiation detector
- place a 1 cm thick absorbing material between the source and the detector
- measure the radiation count from the source for a time period of 3 s
- calculate the count rate in counts per second
- repeat the measurement two more times
The teacher repeats this method for different absorbing materials.
(a) Name a suitable radiation detector that the teacher could use. (1)
(b) State the independent variable in the teacher’s investigation. (1)
(c) Explain why every absorbing material used in the investigation has a thickness of 1 cm. (2)
(d) Suggest one improvement the teacher could make to this method. (1)
(e) The table shows the teacher’s results, count rate in counts per second for seven different absorbing materials.
| Absorbing material | Test 1 | Test 2 | Test 3 | Mean |
| plastic | 248 | 230 | 226 | 235 |
| copper | 138 | 127 | 147 | 137 |
| wood | 226 | 231 | 224 | 227 |
| aluminium | 204 | 211 | 190 | 202 |
| lead | 96 | 102 | 92 | 97 |
| glass | 204 | 192 | 190 | 195 |
| stone | 205 | 200 | 205 | 203 |
(i) On the grid, plot a bar chart of the mean count rate for each absorbing material. (3)
(ii) Why is a bar chart the correct way to display the results? (1)
A absorbing material is a continuous variable
B absorbing material is not a continuous variable
C count rate is a continuous variable
D count rate is not a continuous variable
(iii) A student concludes that plastic is the best absorber of gamma radiation because plastic gives the largest mean count rate.
Evaluate the student’s conclusion. (2)
(Total for Question 9 = 11 marks)
January 2020 Paper 1 Q10
10 This question is about light.
(a) Diagram 1 shows a light ray entering a glass prism.
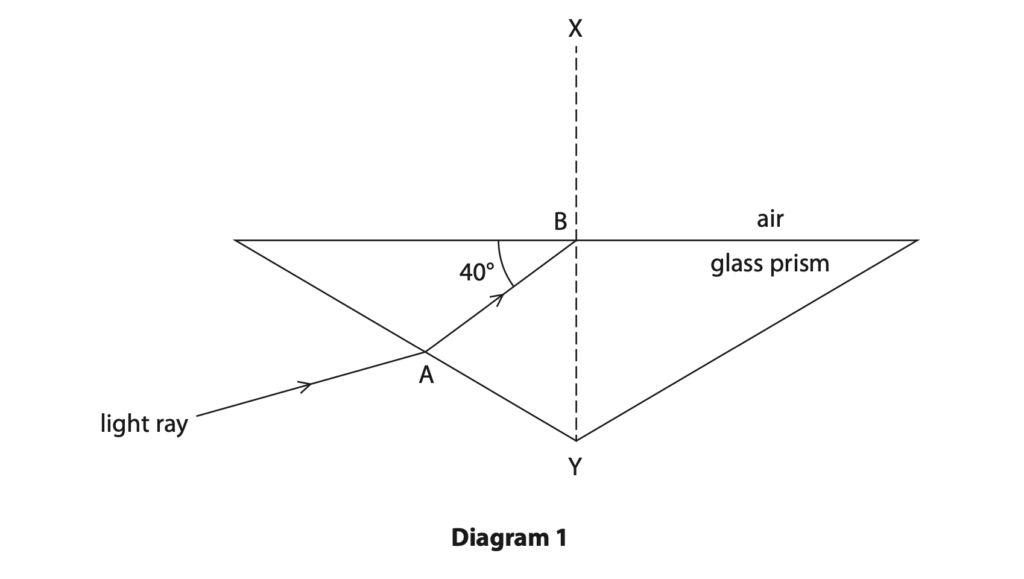
(i) Describe what happens to the light ray when it enters the prism at point A. (2)
(ii) State the name of line XY. (1)
(iii) State the formula linking critical angle and refractive index. (1)
(iv) The refractive index for the glass in this prism is 1.6
Calculate the critical angle for the glass in this prism. (3)
critical angle = …………………………………………………….. °
(v) Complete Diagram 1 by continuing the path of the light ray from point B. (2)
(b) Diagram 2 shows a similar prism that is made from a material with a different refractive index.
The critical angle for the material of this prism is 55°
Complete Diagram 2 by continuing the path of the light ray. (2)
Total for Question 10 = 11 marks
January 2020 Paper 1PR Q1
1 The diagram represents a water wave travelling on the surface of some water.
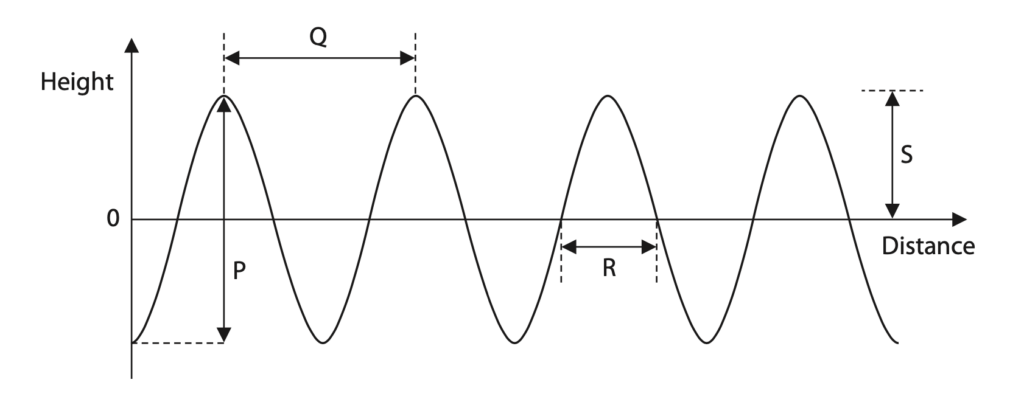
(a) Which arrow represents the amplitude of the wave? (1)
A.P
B.Q
C.R
D.S
(b) Which arrow represents the wavelength of the wave? (1)
A.P
B.Q
C.R
D.S
(c) What type of wave is this water wave? (1)
A electromagnetic
B gravitational
C longitudinal
D transverse
(d) The time period of the wave is 2.7 s.
Calculate the frequency of the wave. (2)
frequency= …………………………………………………….. Hz
Total for Question 1 = 5 marks
January 2020 Paper 1PR Q10
10 This is a question about refraction.
(a) (i) State the formula linking critical angle and refractive index. (1)
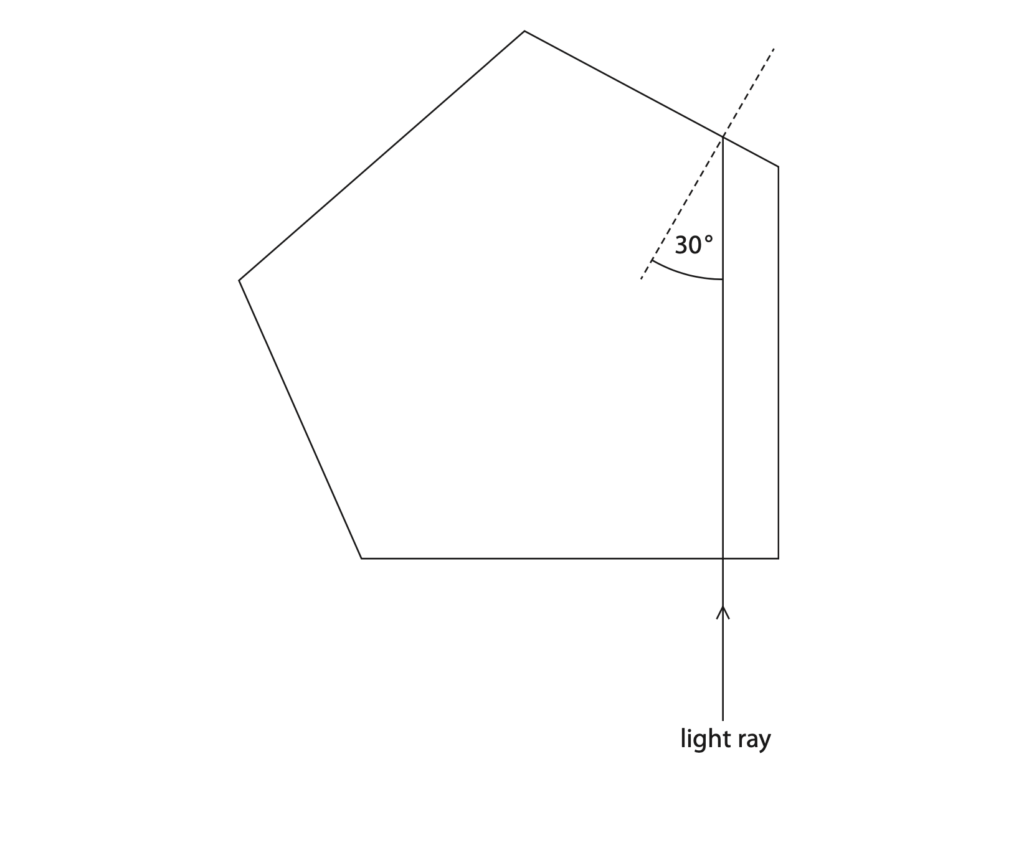
(ii) Diamond has a critical angle of 26 degrees.
Calculate the refractive index of diamond. (2)
refractive index = ……………………………………………………..
(iii) The diagram shows a light ray entering a block of diamond.
Complete the diagram to show the light ray emerging from the block. (3)
(b) A student plans an investigation to determine the refractive index of glass.
The student uses a graph of sin(i) against sin(r) to determine the refractive index.
(i) The student uses this equipment
- a ray box
- a rectangular glass block
- a protractor
- a pencil
Describe how the student should collect her data.
You may draw a diagram to support your answer. (4)
(ii) The table shows the student’s results.
| Sin(i) | Sin(r) |
| 0.10 | 0.06 |
| 0.30 | 0.19 |
| 0.50 | 0.31 |
| 0.70 | 0.44 |
| 0.90 | 0.56 |
Plot a graph of the student’s results. (3)
(iii) Draw a line of best fit. (1)
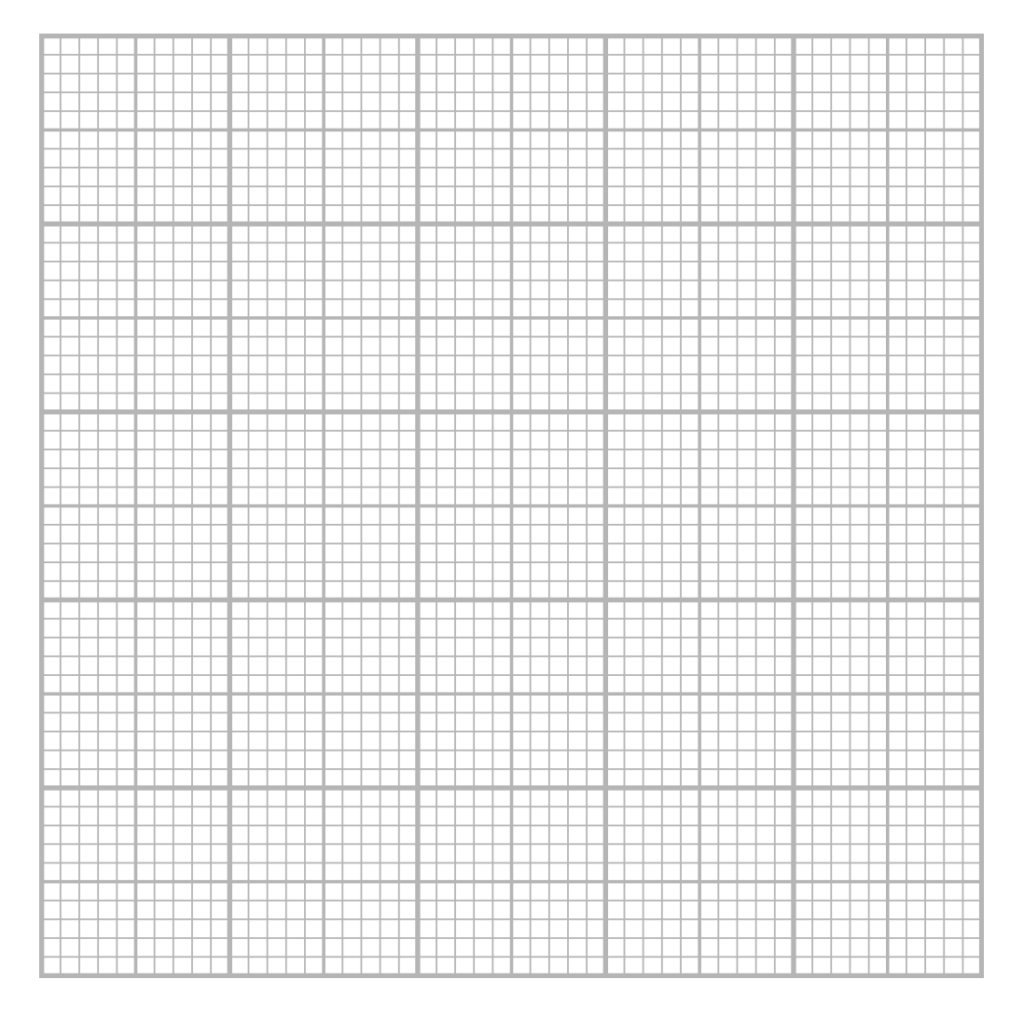
(iv) Use the graph to calculate the refractive index of the glass block. (2)
refractive index = …………………………………………………….
(Total for Question 10 = 16 marks)
January 2020 Paper 2P Q5
5 A sonometer is a piece of equipment used to investigate the frequency of waves on a string.
The photograph shows a sonometer.
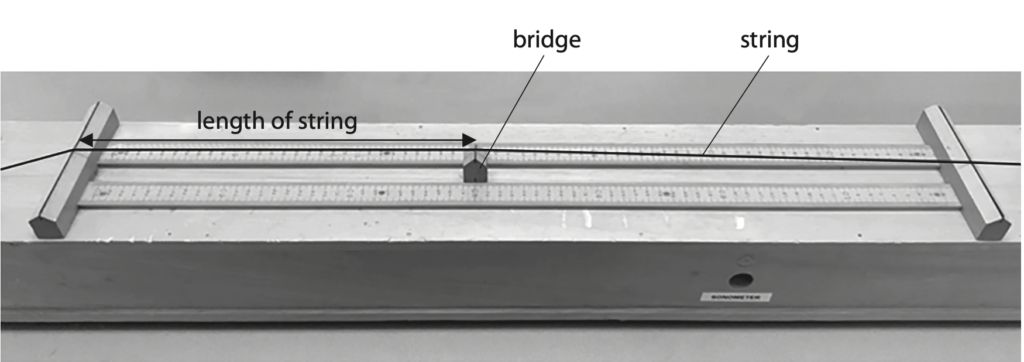
The string is under tension. When the string is plucked it vibrates to produce a sound wave.
(a) Describe how an oscilloscope should be used to measure the frequency of the sound wave from the sonometer. (4)
(b) A student investigates how the frequency of sound from the sonometer varies with the length of the string.
This is the student’s method.
- apply a constant tension force to the string
- pluck the string and measure the frequency of the sound wave produced
- move the bridge to change the length of the string
- pluck the string and measure the new frequency of the sound wave produced
Repeat the method for different lengths of string.
(i) Give a control variable for the student’s investigation. (1)
(ii) The table shows the student’s results. Recorded results are Frequency in Hz
| String length in cm | Test 1 | Test 2 | Test 3 | Mean |
| 20 | 105 | 104 | 108 | 106 |
| 40 | 53 | 54 | 52 | 53 |
| 60 | 36 | 32 | 35 | |
| 80 | 25 | 28 | 26 | 26 |
| 100 | 22 | 20 | 21 | 21 |
| 120 | 20 | 17 | 18 | 18 |
| 140 | 15 | 15 | 14 | 15 |
Calculate the mean frequency for a string length of 60 cm. (2)
mean frequency = …………………………………………………….. Hz
(iii) Plot a graph of the mean frequency and string length data on the grid. (3)
(iv) Draw the curve of best fit. (1)
(v) Determine the string length needed to produce a sound wave of frequency 75 Hz. (1)
string length = …………………………………………………….. cm
(vi) The student cannot hear the sound from the sonometer for some of the string lengths tested.
Explain which of the string lengths produce sounds that humans cannot hear. (2)
(Total for Question 5 = 14 marks)
January 2020 Paper 2PR Q8
8 Diagram 1 shows two identical buzzers connected with springs.

Spring A is connected to a post.
A force acts on the apparatus for a short period of time, pulling both buzzers to the right.
During this time, buzzer A moves 2 cm and buzzer B moves 4 cm.
(a)(i) Explain why buzzer B travels with twice the average speed of buzzer A. (2)
(ii) A student connects the microphone to an oscilloscope to measure the frequency of sound from the two buzzers while the force acts on the arrangement.
Explain the difference in the measured frequencies of sound from buzzer A compared to buzzer B. (3)
(b) Diagram 2 shows an oscilloscope trace.
The trace represents the sound wave received by the microphone from buzzer A.
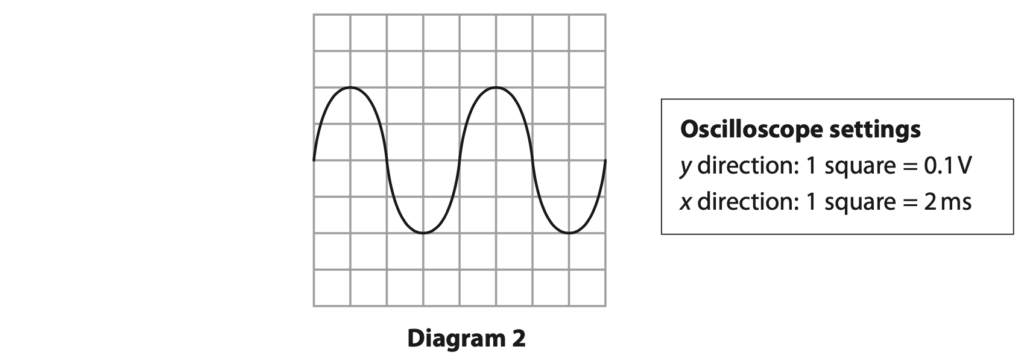
Measure the period of the sound waves from buzzer A.
Give your answer in standard form. (3)
period = ………………………………………. s
(c) Diagram 3 shows two distant galaxies and the Earth.

Light emitted from a nearby star has a wavelength of 590 nm.
The light from an identical star in galaxy P arrives at the Earth.
The wavelength of the light from the star in galaxy P is 600 nm.
(i) Calculate the change in wavelength for light from the star in galaxy P. (1)
change in wavelength = ………………………………………. nm
(ii) Galaxy Q is twice as far away from the Earth as galaxy P.
Suggest how the speed of galaxy Q relates to the speed of galaxy P (1)
(iii) Suggest a value for the change in wavelength of light from an identical star in
galaxy Q when the light arrives at the Earth. (1)
change in wavelength = ………………………………………. nm
(iv) Explain how comparing the speeds of the two galaxies provides evidence for
the Big Bang theory. (4)
(Total for Question 8 = 15 marks)
June 2020 Paper 1 Q1
1 This question is about wave behaviour.
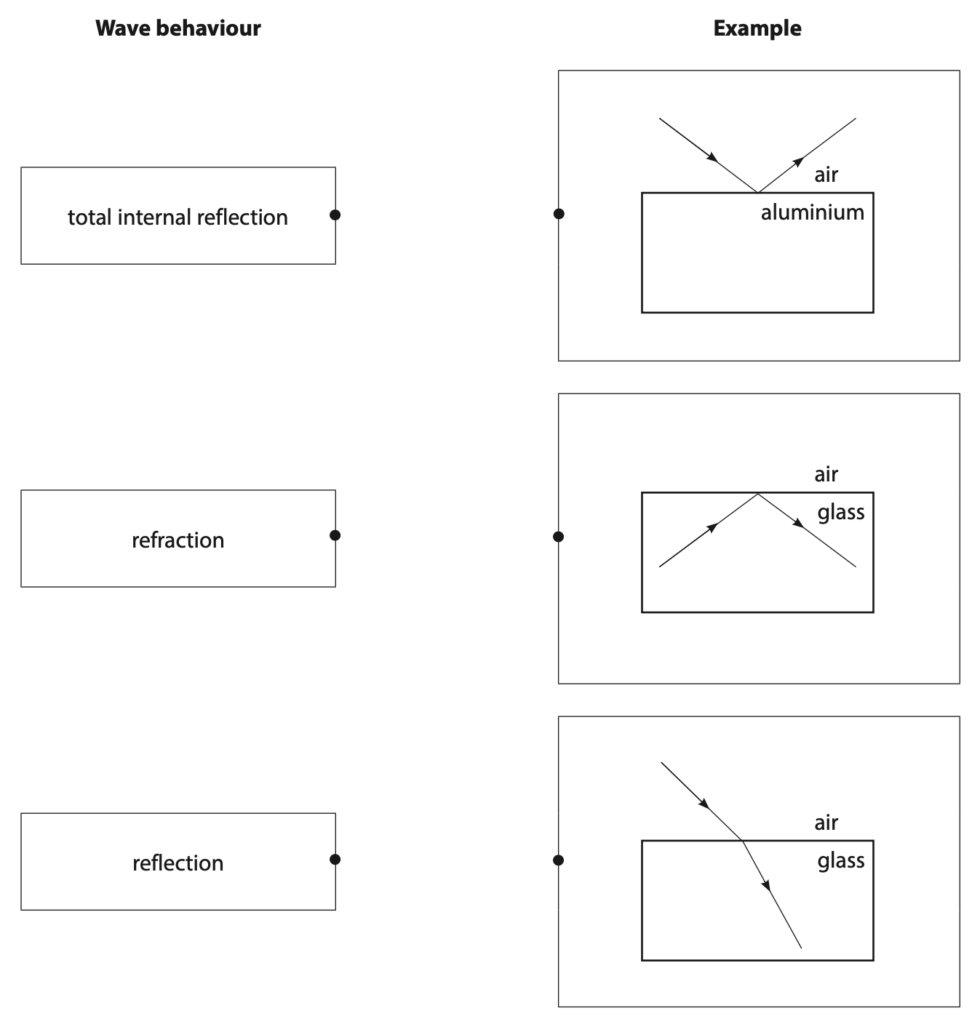
(a) The boxes give three types of wave behaviour and the diagrams give three examples of wave behaviour.
Draw one straight line from each wave behaviour to the example that best shows that behaviour. (3)
(b) State two properties that all waves have in common. (2)
(Total for Question 1 = 5 marks)
June 2020 Paper 1 Q2
2 This question is about the movement of a train.
The diagram shows the train on a track.
The train starts braking at point P and stops moving at point Q.

The graph shows how the train’s velocity changes with time as the train travels from P to Q.
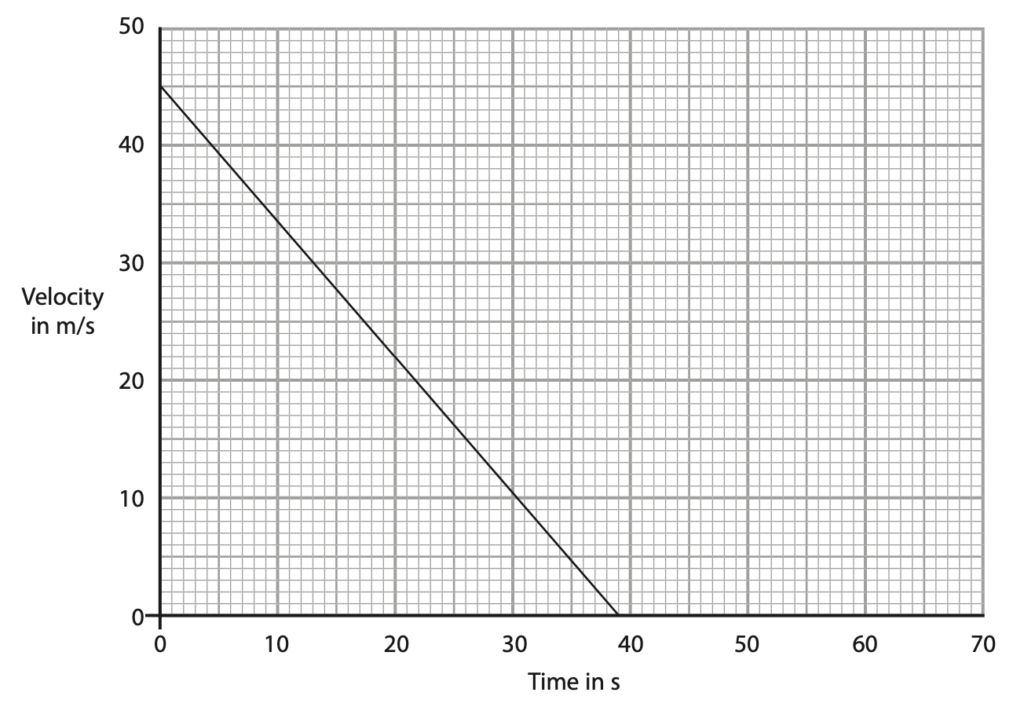
(a) Calculate the acceleration of the train. (3)
acceleration=………………………………………… m/s2
(b) Calculate the distance travelled by the train from P to Q. (3)
distance=………………………………………… m
(c) Draw a line on the graph to show how the train’s velocity will change if its initial velocity is the same but the braking force is lower. (2)
(Total for Question 2 = 8 marks)
June 2020 Paper 1P Q8
8 This question is about atmospheric optical illusions.
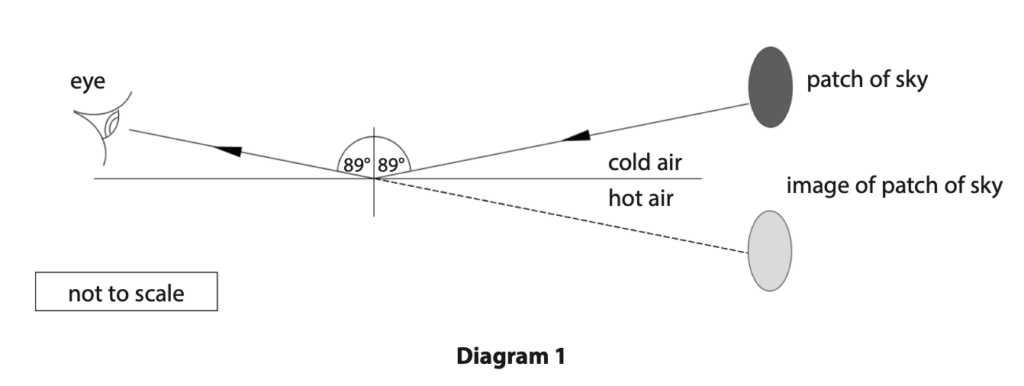
(a) A mirage is an optical illusion formed due to total internal reflection of light from the sky at the boundary between cold air and hot air.
Diagram 1 shows how a mirage is formed.
(i) State the formula linking critical angle and refractive index. (1)
(ii) The critical angle of the cold air at the boundary is 88.500°
Calculate the refractive index of the cold air.
Give your answer to 5 significant figures. (3)
refractive index = …………………………………………
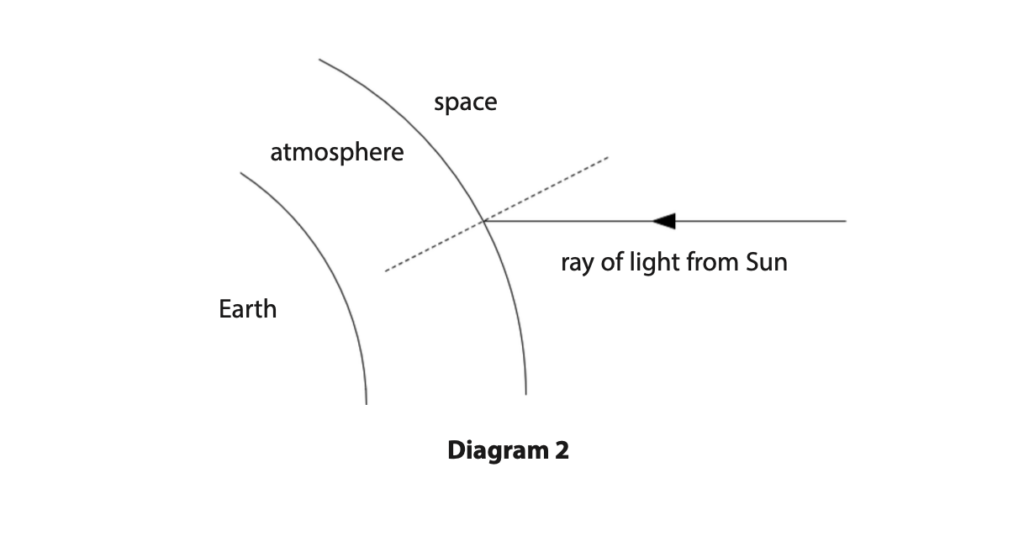
(b) (i) Diagram 2 shows a ray of light from the Sun.
The refractive index of the atmosphere is greater than the refractive index of space.
Complete the diagram by drawing the path of the ray of light through the atmosphere. (2)
(ii) Diagram 3 shows a ray of light from the Sun when the Sun is directly overhead.
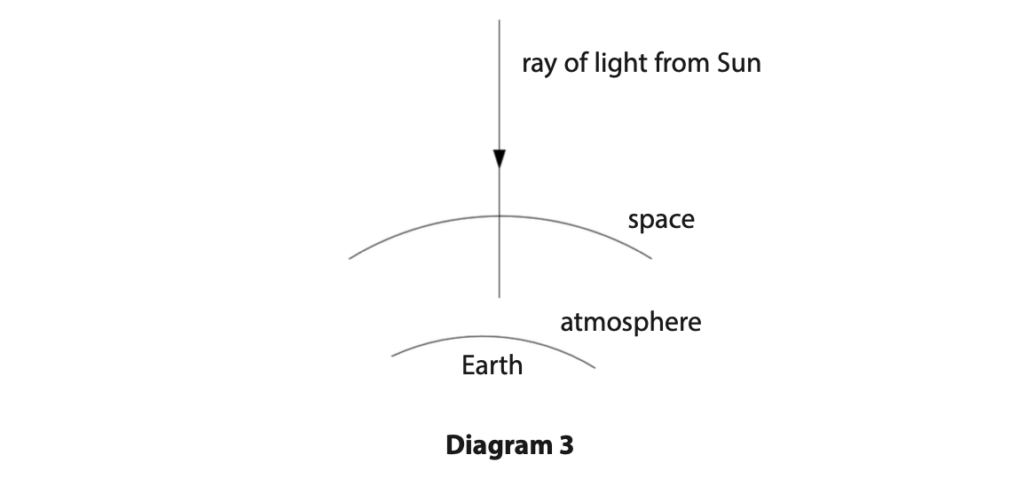
Explain why the ray of light does not change direction when it enters the atmosphere. (2)
(iii) Explain why the wavelength of the light reduces when it enters the atmosphere. (2)
(iv) Suggest why the Sun appears not to be circular when it is close to the horizon
at sunset. (1)
(Total for Question 8 = 11 marks)
June 2020 Paper 1PR Q12
12 This question is about refraction.
(a) Diagram 1 shows a ray of light incident on the boundary between a liquid called acetone and air.
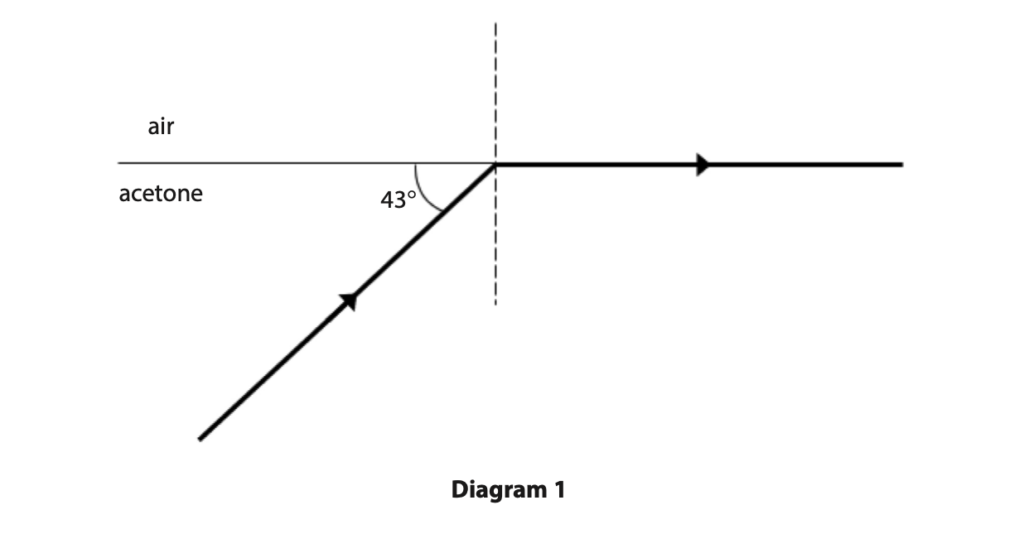
(i) Calculate the critical angle for the boundary between acetone, and air. (1)
critical angle = ……………………………………………………………………….. °
(ii) State the formula linking critical angle and refractive index. (1)
(iii) Calculate the refractive index of acetone. (2)
refractive index = ………………………………………………………………………..
(b) Diagram 2 shows a ray of light incident on the boundary between water and air.
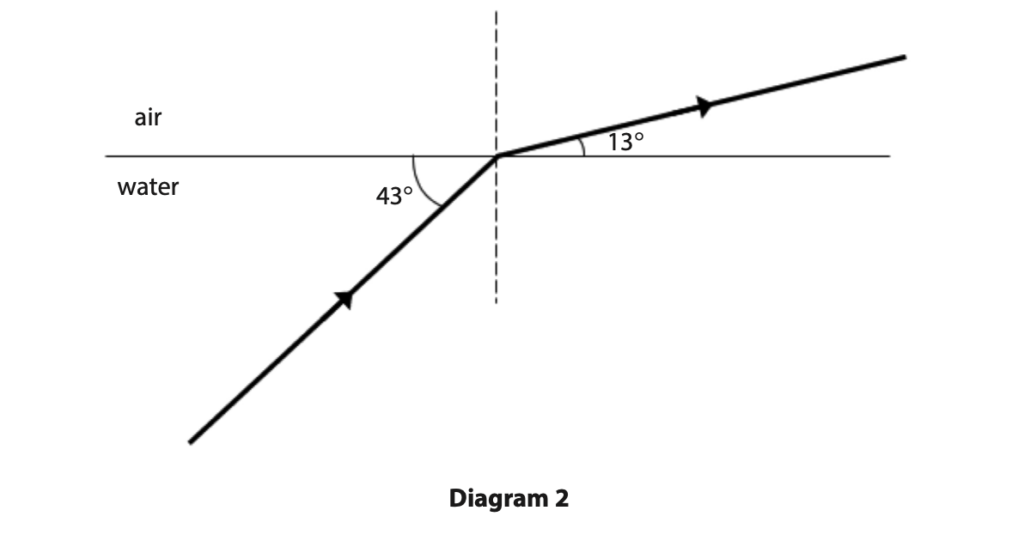
Explain how the refractive index of water compares to the refractive index of acetone. (3)
(Total for Question 12 = 7 marks)
June 2020 Paper 2P Q5
5. This question is about using radio waves to track an aeroplane.
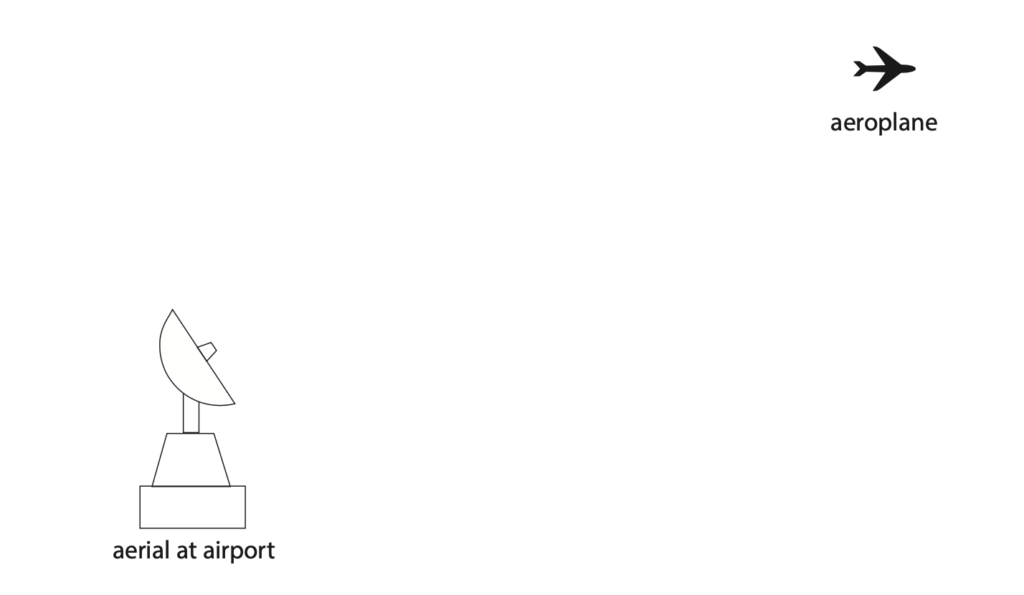
(a) Radio waves are emitted from an aerial at an airport, and are then reflected back to the aerial from an aeroplane.
The time taken between emitting the radio waves and receiving the waves back at the aerial is 1.9 milliseconds.
Show that the aeroplane is approximately 300 km away from the aerial. (3)
[speed of radio waves = 3.0 × 10⁵ km/s]
(b) As the aeroplane travels away from the airport, it sends a signal to the airport using radio waves with a wavelength of 1.2 m.
When the signal is received at the airport, the wavelength is 1.1 × 10⁻⁶ m longer than when it is emitted by the aeroplane.
Calculate the speed of the aeroplane using the formula (3)
change of wavelength/wavelength = speed of aeroplane/speed of radio wave
[speed of radio waves = 3.0 × 10⁸ m/s]
speed of aeroplane = …………………………………………………. m/s
(Total for Question 5 = 6 marks)
June 2020 Paper 2PR Q2
2 X-rays are electromagnetic waves used to obtain images of bones.
An x-ray machine produces x-ray waves with a frequency of 1.25 × 10¹⁸ Hz. (a)
Calculate the time period of these x-rays. (2)
time period = ………………………………………………… s
(b) X-rays have a speed of 3.00 × 10⁸ m/s in air.
Calculate the wavelength of these x-rays. (3)
wavelength = ………………………………………………… m
(Total for Question 2 = 5 marks)
June 2020 Paper 2PR Q4
4 A student investigates the speed of sound in air.
(a) The student sets up two microphones, A and B, as shown in Diagram 1.

The microphones are connected to a datalogger.
A sound is made to the left of microphone A.
The datalogger records the time when the sound wave reaches each microphone.
The student uses the data to calculate the time taken for the sound wave to travel from microphone A to microphone B.
(i) Describe how the student could determine the speed of sound in air using his calculated value of time taken. (3)
(ii) Suggest why the student does not use a stop clock in this investigation. (1)
(b) The student investigates how the speed of sound in air varies with temperature.
He places several Bunsen burners in the space between the microphones, as shown in diagram 2.
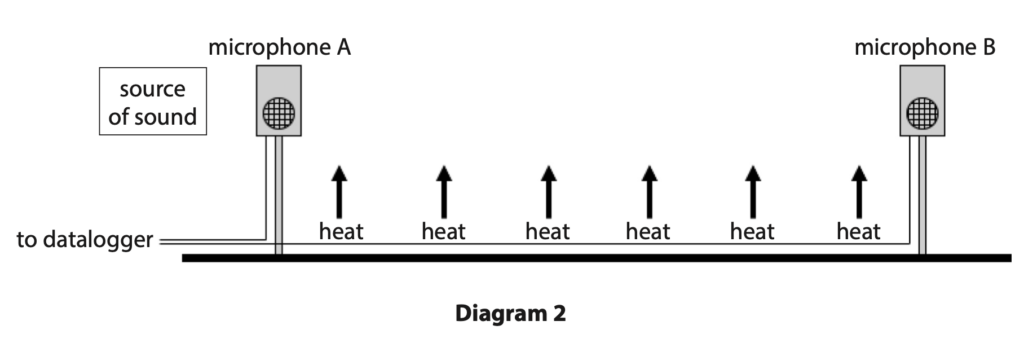
He uses this method
- light all the Bunsen burners on a low heating flame
- measure the air temperature in three places between the microphones using three temperature sensors
- use the datalogger to record the time taken for a sound wave to travel from microphone A to microphone B
- determine the speed of sound
The student repeats this method as the air temperature increases.
(i) Suggest why it is important for all the Bunsen burners to burn the same amount of gas each second. (1)
(ii) The table shows the student’s results. Temperature in °C
| sensor 1 | sensor 2 | sensor 3 | mean | Time in ms | Speed in m/s |
| 20.3 | 20.2 | 19.9 | 20.1 | 4.37 | 344 |
| 29.9 | 31.3 | 30.0 | 30.4 | 4.29 | 350 |
| 39.7 | 41.0 | 39.0 | 39.9 | 4.22 | 358 |
| 51.0 | 50.2 | 49.3 | 50.2 | 4.15 | 362 |
| 59.8 | 61.5 | 58.6 | 4.08 | 368 |
Calculate the mean temperature for the last row in the table.
Give your answer to a suitable number of decimal places. (2)
mean temperature = …………………………………………………. °C
(iii) The student plots his results and draws the line of best fit.
Draw a circle around the anomalous result. (1)
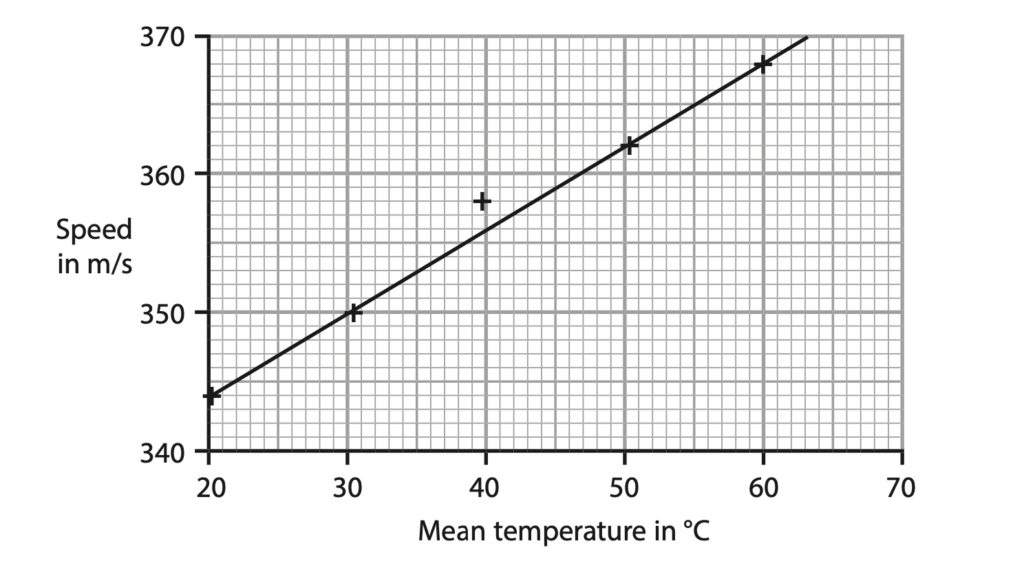
(iv) State how the student should deal with the anomalous result. (1)
(v) Explain why a line graph is the correct type of graph to display these results. (2)
(vi) Describe the relationship between the speed of sound in air and temperature. (2)
(Total for Question 4 = 13 marks)
You can find more IGCSE Physics Past Year Questions by the Wave topic below:


